
A Deep Dive into Recent Arena Data
Today, we're excited to release a new dataset of recent battles from LMArena! The dataset contains 140k conversations from the text arena.

Today, we're excited to release a new dataset of recent battles from LMArena! The dataset contains 140k conversations from the text arena. Download or view the data here! For a more detailed overview to the data, please refer to this dedicated section.
We take this opportunity to dive deeper into the characteristics of our data, with special attention to its dynamic changes over time.
In this blog, we will cover:
- Data Overview: an overview of language, category, and topic distributions
- Score Changes: a look at Arena score changes over time
- Evaluation Order: a brief explanation of this new feature and how it affects model scores
- Model-Specific Analysis: a closer look at the score shifts of specific models
- Style Coefficients: a closer look at style coefficients on recent data
- Further Analysis: further exploration and results
- Released Dataset Overview: a brief guide and introduction of our publicly available dataset
The analysis is based on data collected between April 17th and July 25th inclusive. To illustrate the changes in trends over time, we study differences between the data collected from the new and improved UI, officially launched on May 27th, and the data from the old UI.
Data Overview
We explore the distribution of categories, languages, and topics in our data, focusing both on their shifts over time and their recent distribution.
In this section, for statistics calculated using data collected from the new UI, only votes with evaluation order equal to one are included. Evaluation order is a new feature; we define the nth evaluation order as the nth vote cast in a single continuous conversation (an evaluation session). The underlying assumption is that all votes within the same evaluation session generally come from a single user engaging in a continued conversation about the same topic. To avoid over-representing individual sessions, each evaluation session contributes only one data point to the analyses in this section.
For a more detailed analysis of evaluation order, go to the section here.
Category Distribution
In Table 1, we show the recent distribution of prompt categories. About a third of submitted prompts are hard prompts.
| Category | Percentage |
|---|---|
| Hard Prompt | 37.33% |
| Instruction Following | 21.01% |
| Math | 6.94% |
| Creative Writing | 11.65% |
| Coding | 25.78% |
| Long Query | 13.46% |
| Multi-turn | 17.76% |
Table 1. Distribution of new prompts across categories on data collected from the new UI only.
In Figure 1 we look at how the category distribution has changed over time. We see a substantial increase in hard prompts and coding. We also see a decrease in instruction following, math, and creative writing. The decrease in instruction following is explained by the fact that we implemented a more stringent classifier for labeling prompts as instruction following (details to follow).
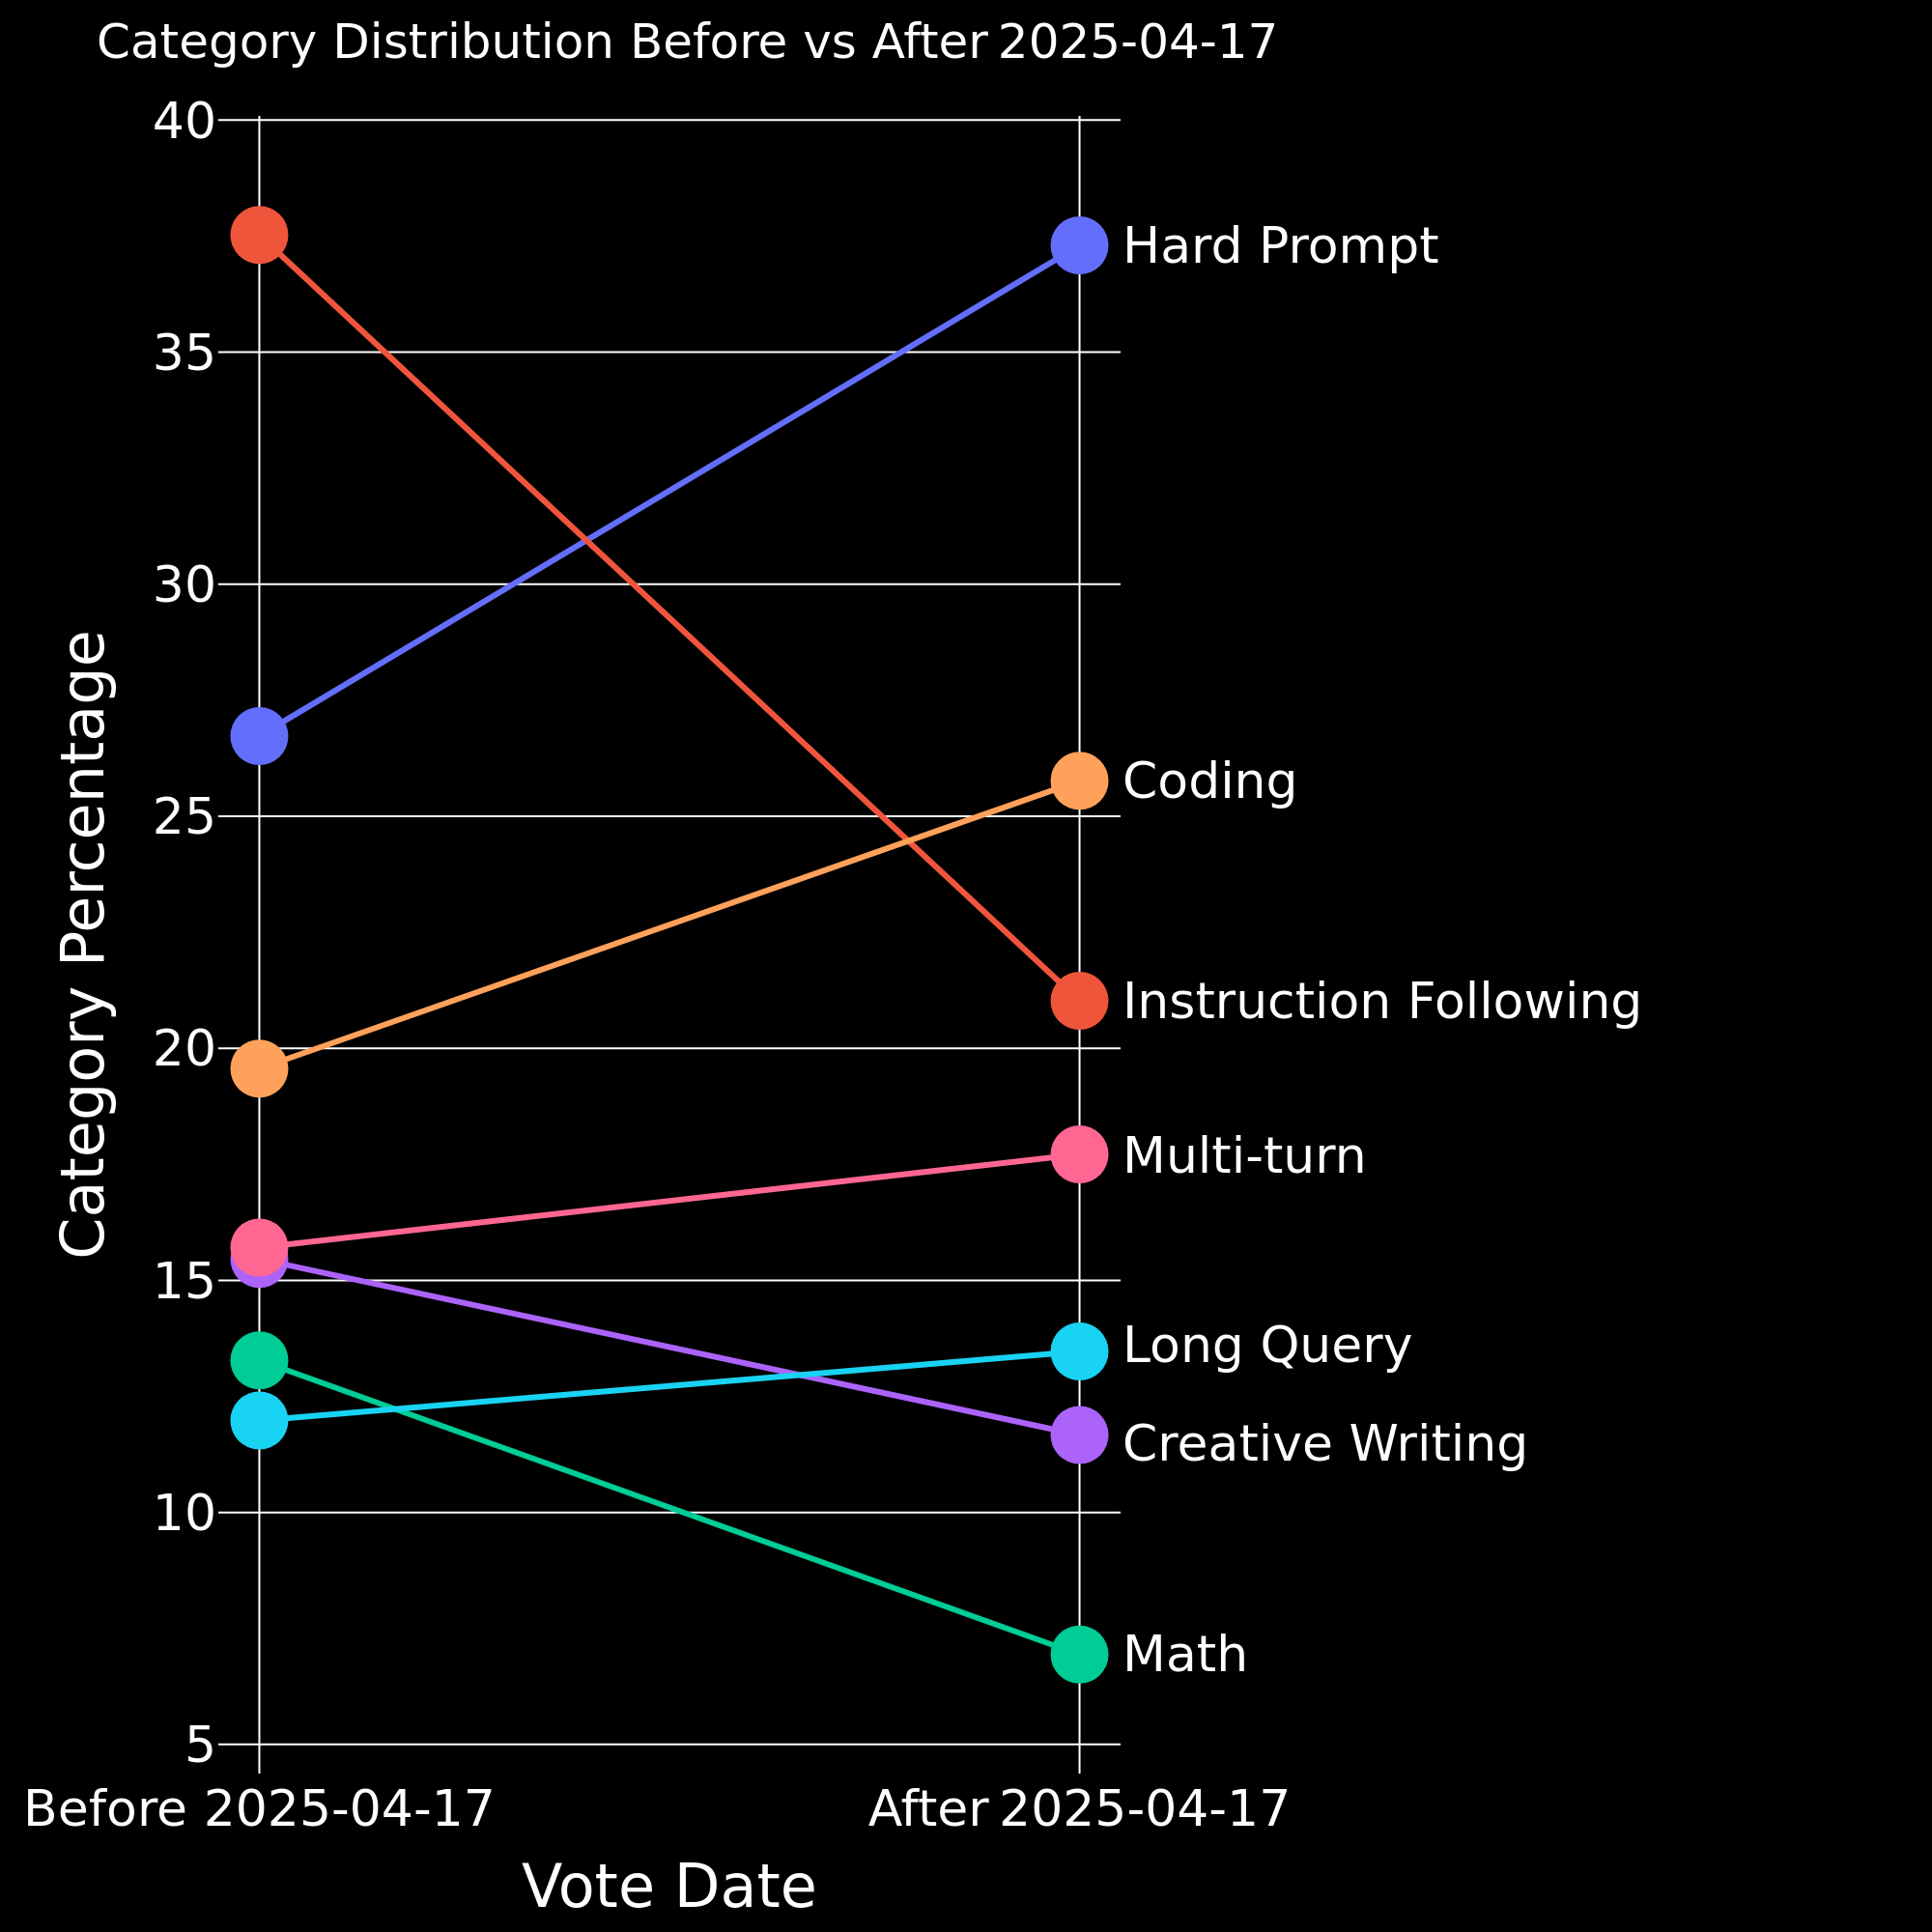
Figure 1. Comparison of category distribution before vs. after 2025-04-17.
In Figure 2 we provide a more fine-grained analysis: we plot the seven-day rolling average of the category distribution starting the beginning of 2024.
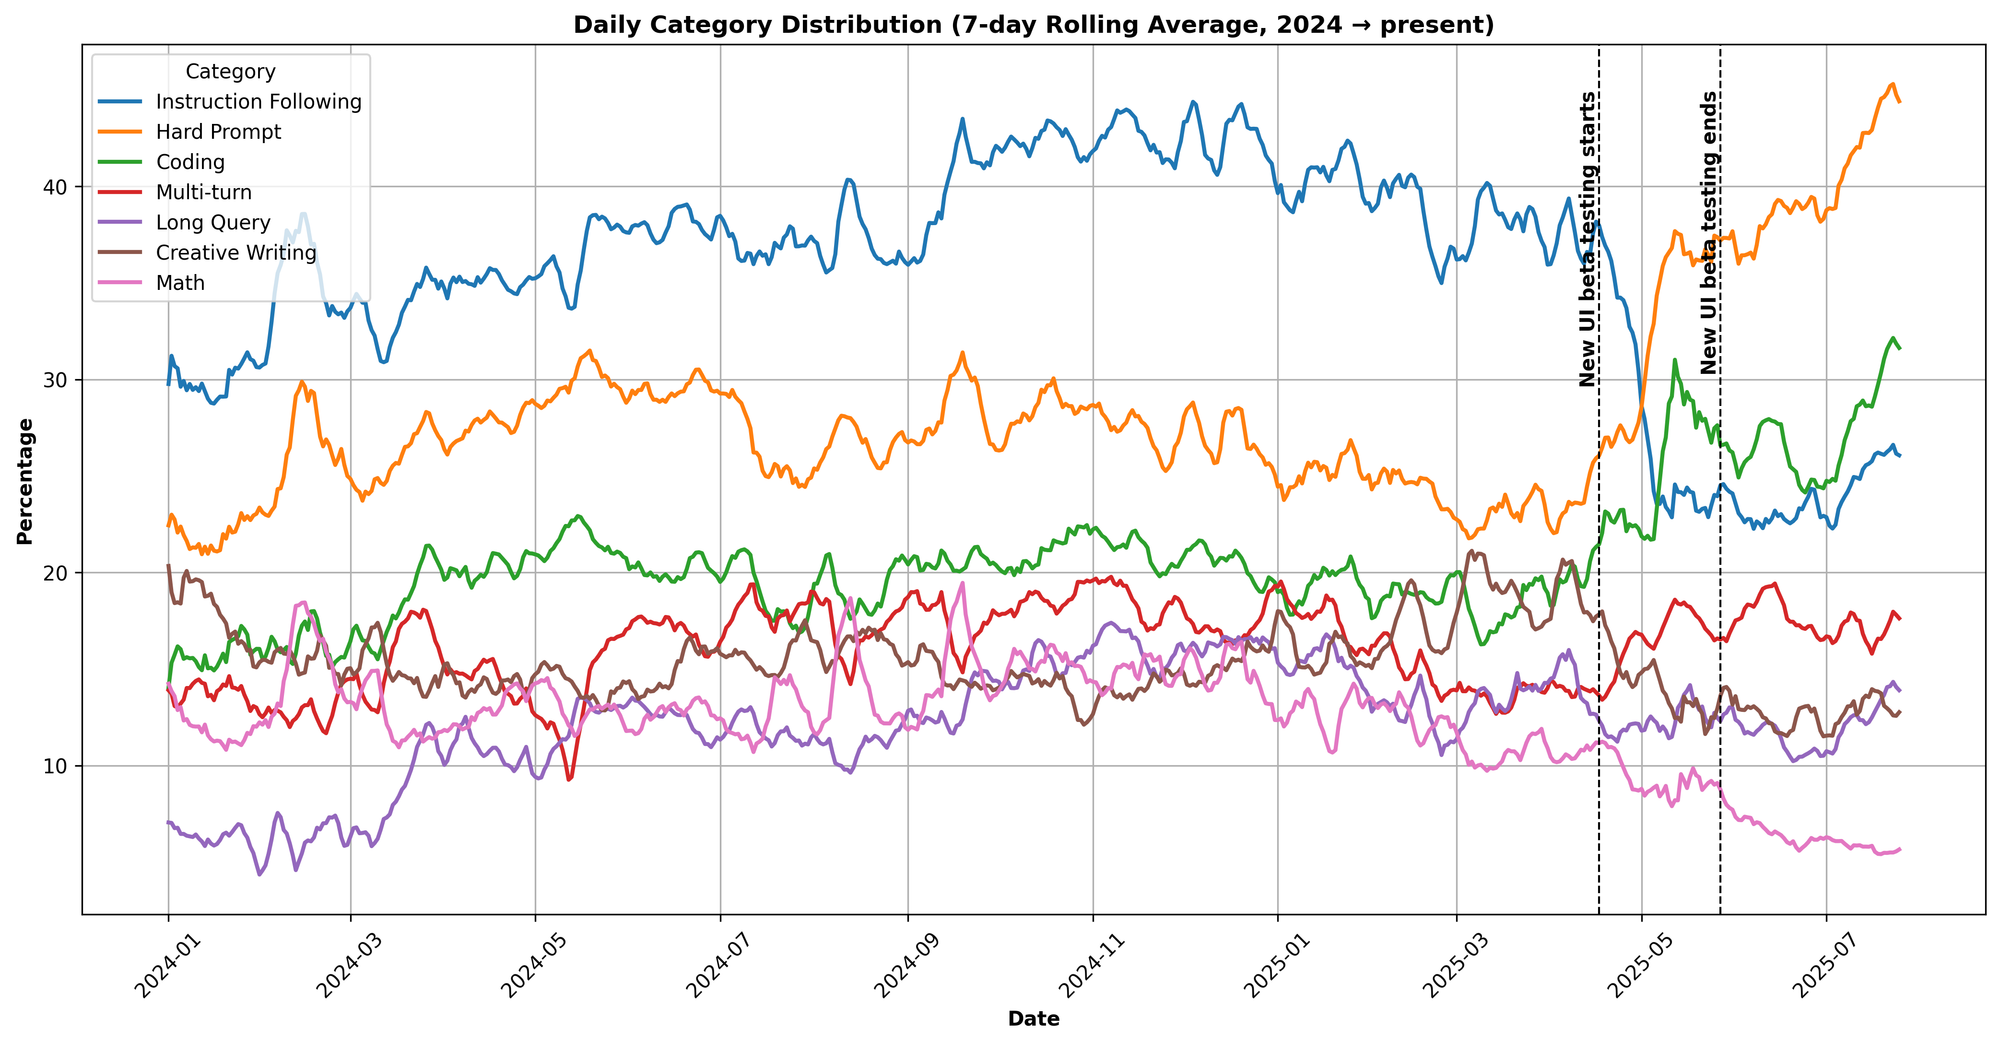
Figure 2. Change in category distribution over time.
Why does instruction following drop so much? This category distribution shift is largely explained by a change in the classification model (the LLM used to assign categories to individual prompts) from llama-v3-70b-instruct to deepseek-v3-0324.
To select the classification model, we run label_bench – evaluating each candidate’s labeling accuracy, precision, and recall in a small dataset against gold labels obtained via four large LLMs: claude-3-7-sonnet, deepseek-r1, gemini-2.0-pro, and gpt-4.5. We define gold labels as True for a particular category if at least two models vote True. More details about the label_bench method can be found here.
Results for the candidate models are shown below.
| Category | Model | Accuracy | Precision | Recall |
|---|---|---|---|---|
| IF | llama-v3-70b-instruct | 0.856 | 0.566 | 0.886 |
| IF | deepseek-v3-0324 | 0.929 | 0.886 | 0.698 |
| Hard | llama-v3-70b-instruct | 0.730 | 0.772 | 0.487 |
| Hard | deepseek-v3-0324 | 0.770 | 0.791 | 0.599 |
| Math | llama-v3-70b-instruct | 0.962 | 0.798 | 0.896 |
| Math | deepseek-v3-0324 | 0.968 | 0.832 | 0.898 |
| Creative Writing | llama-v3-70b-instruct | 0.962 | 0.838 | 0.819 |
| Creative Writing | deepseek-v3-0324 | 0.970 | 0.876 | 0.856 |
Table 2. Comparison of the old and new classifier models across four categories, showing accuracy, precision, and recall.
As shown in Table 2, deepseek-v3-0324 exhibits significantly higher precision and lower recall in the instruction following (IF) category, strongly suggesting that it is more selective in its labeling, resulting in fewer prompts being classified as IF.
Language Distribution
Recent data from the new UI comes from over 100 languages, with slightly more than half being English. We show the comparison in Figure 3.
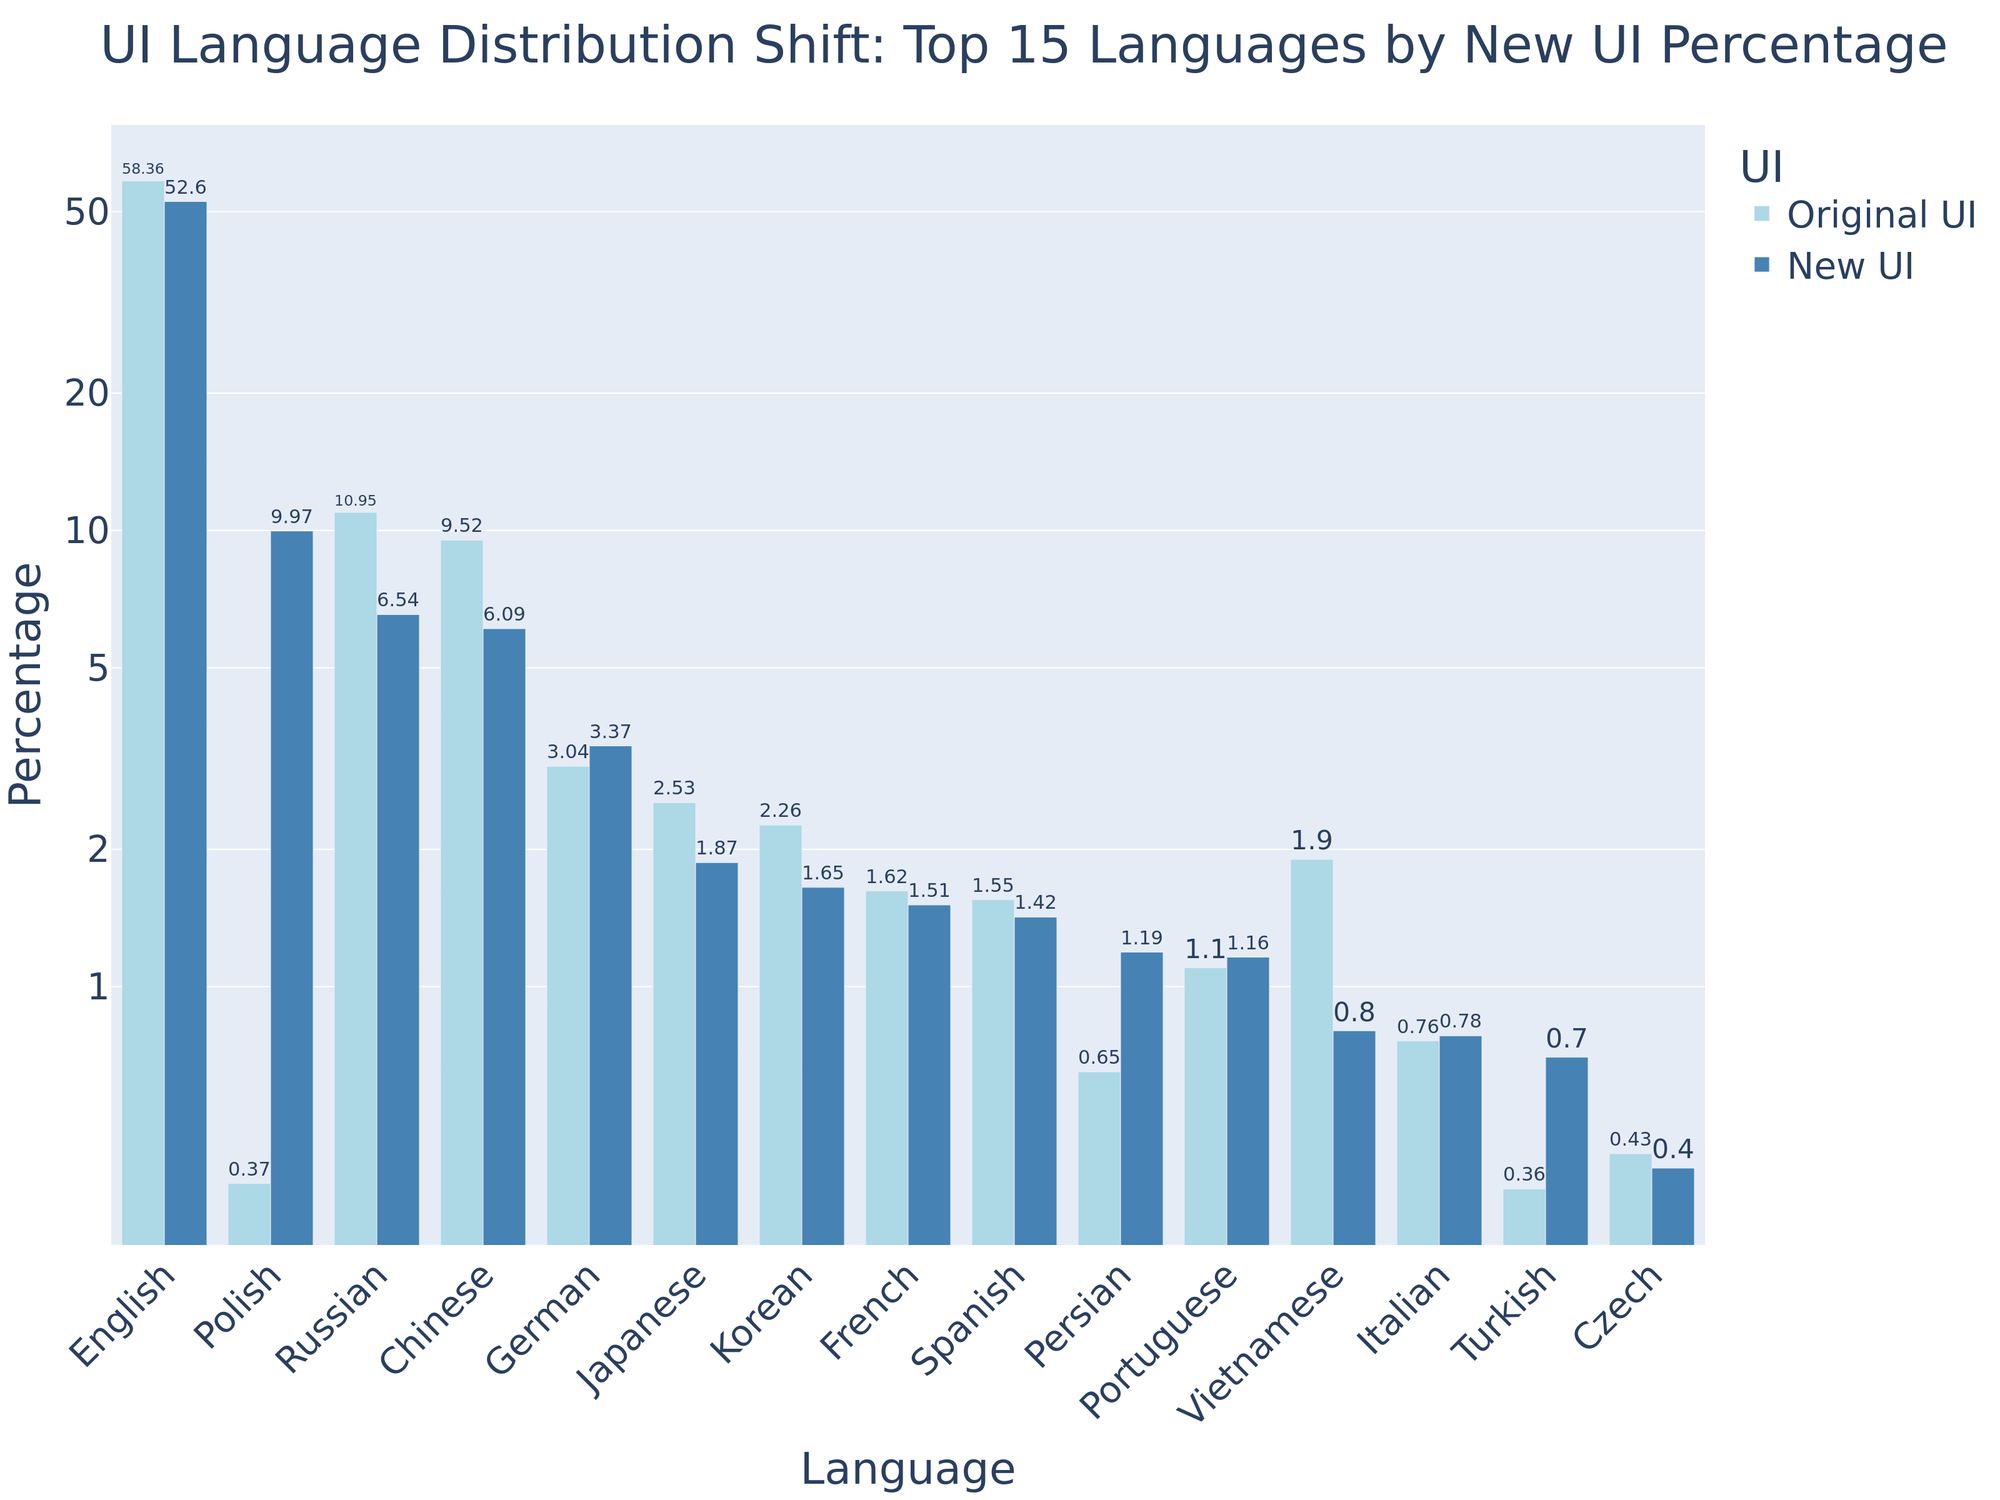
Figure 3. Language distribution comparison between the old and new UI for the top 15 languages on the new UI, ordered by their percentage.
In Figure 4, we show the seven-day rolling average of the language distribution starting the beginning of 2024.
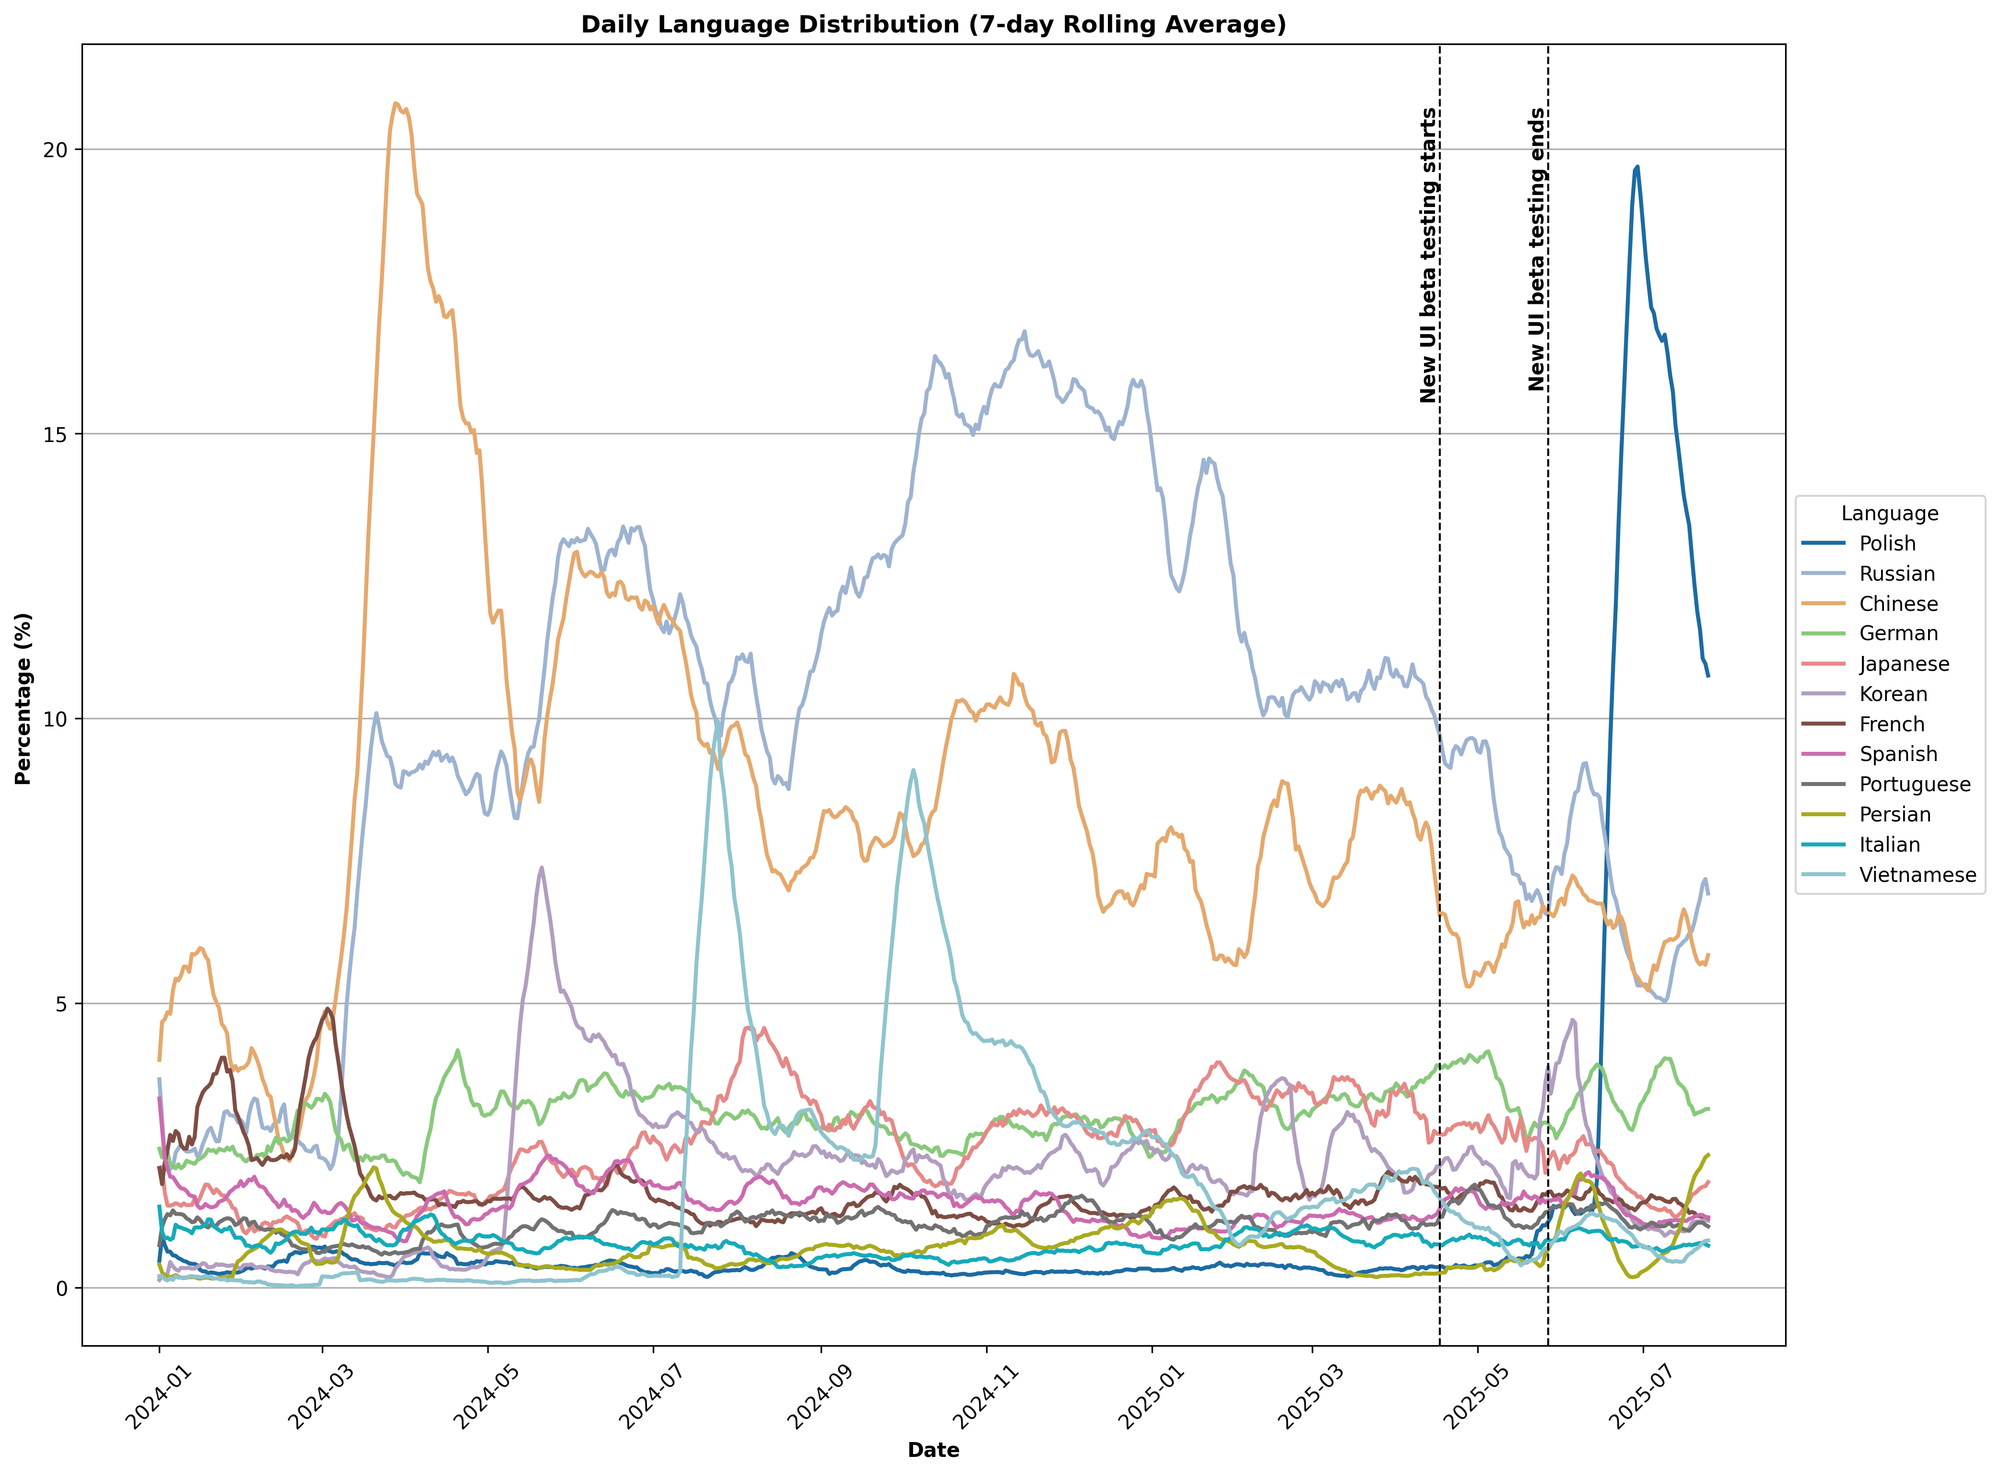
Figure 4. Language distribution over time.
Topic Distribution
Using our Arena Explorer pipeline, we build an interactive topic distribution graph below.
Score Changes
To take a deeper look into personal preference shifts, we explore model score changes over time.
Recall that Arena scores are invariant to shifts: the relative strengths of models are captured by the differences between their Arena scores, while the absolute value of the scores is determined by anchoring. Anchoring is a method that fixes a particular model to have a particular score; all other scores are derived relative to that model.
The graphs below anchor mixtral-8x7b-instruct-v0.1 at 1114.0: each time the leaderboard is calculated, mixtral's score always stays at 1114. This fixes the scale of the leaderboard across time periods, making the scores comparable.
In Figure 5, we show Arena score changes over the full distribution of our prompts.
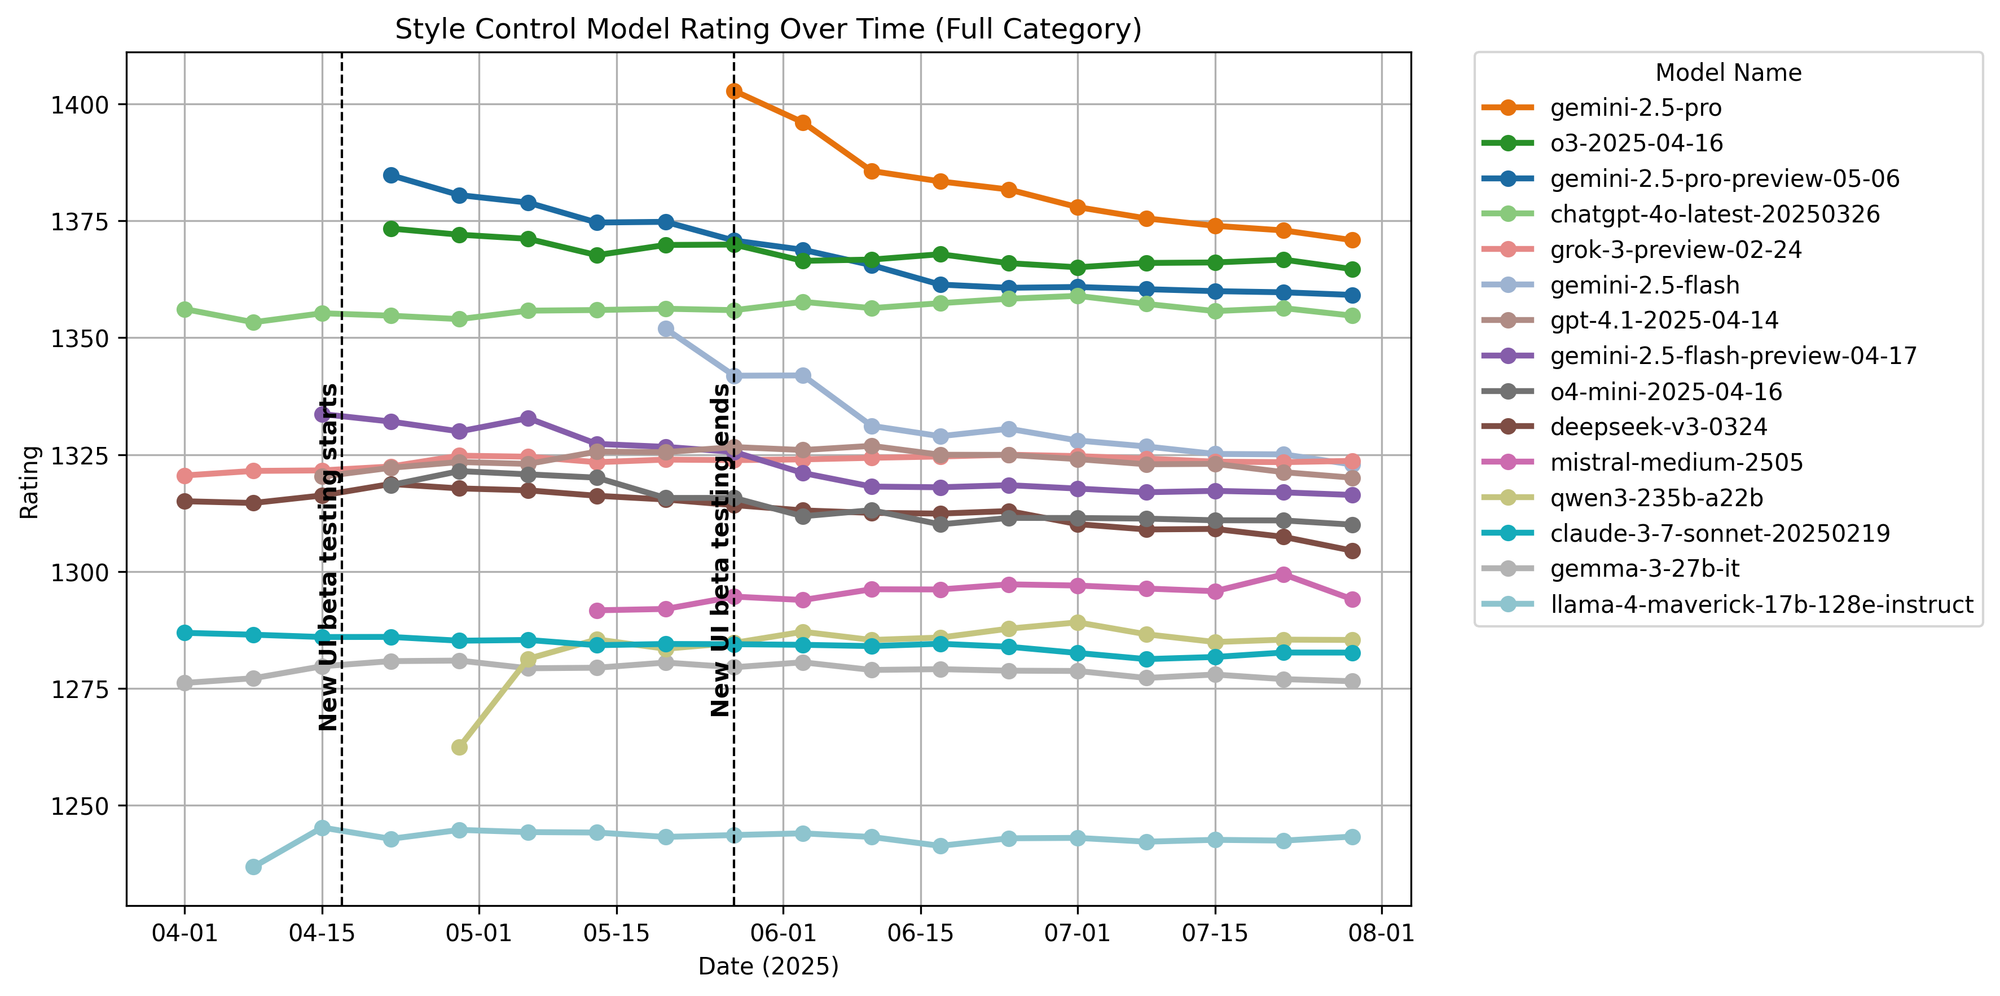
Figure 5. Model ratings over time.
Expand for selected categorical shifts (coding, creative writing, hard prompt)
Coding
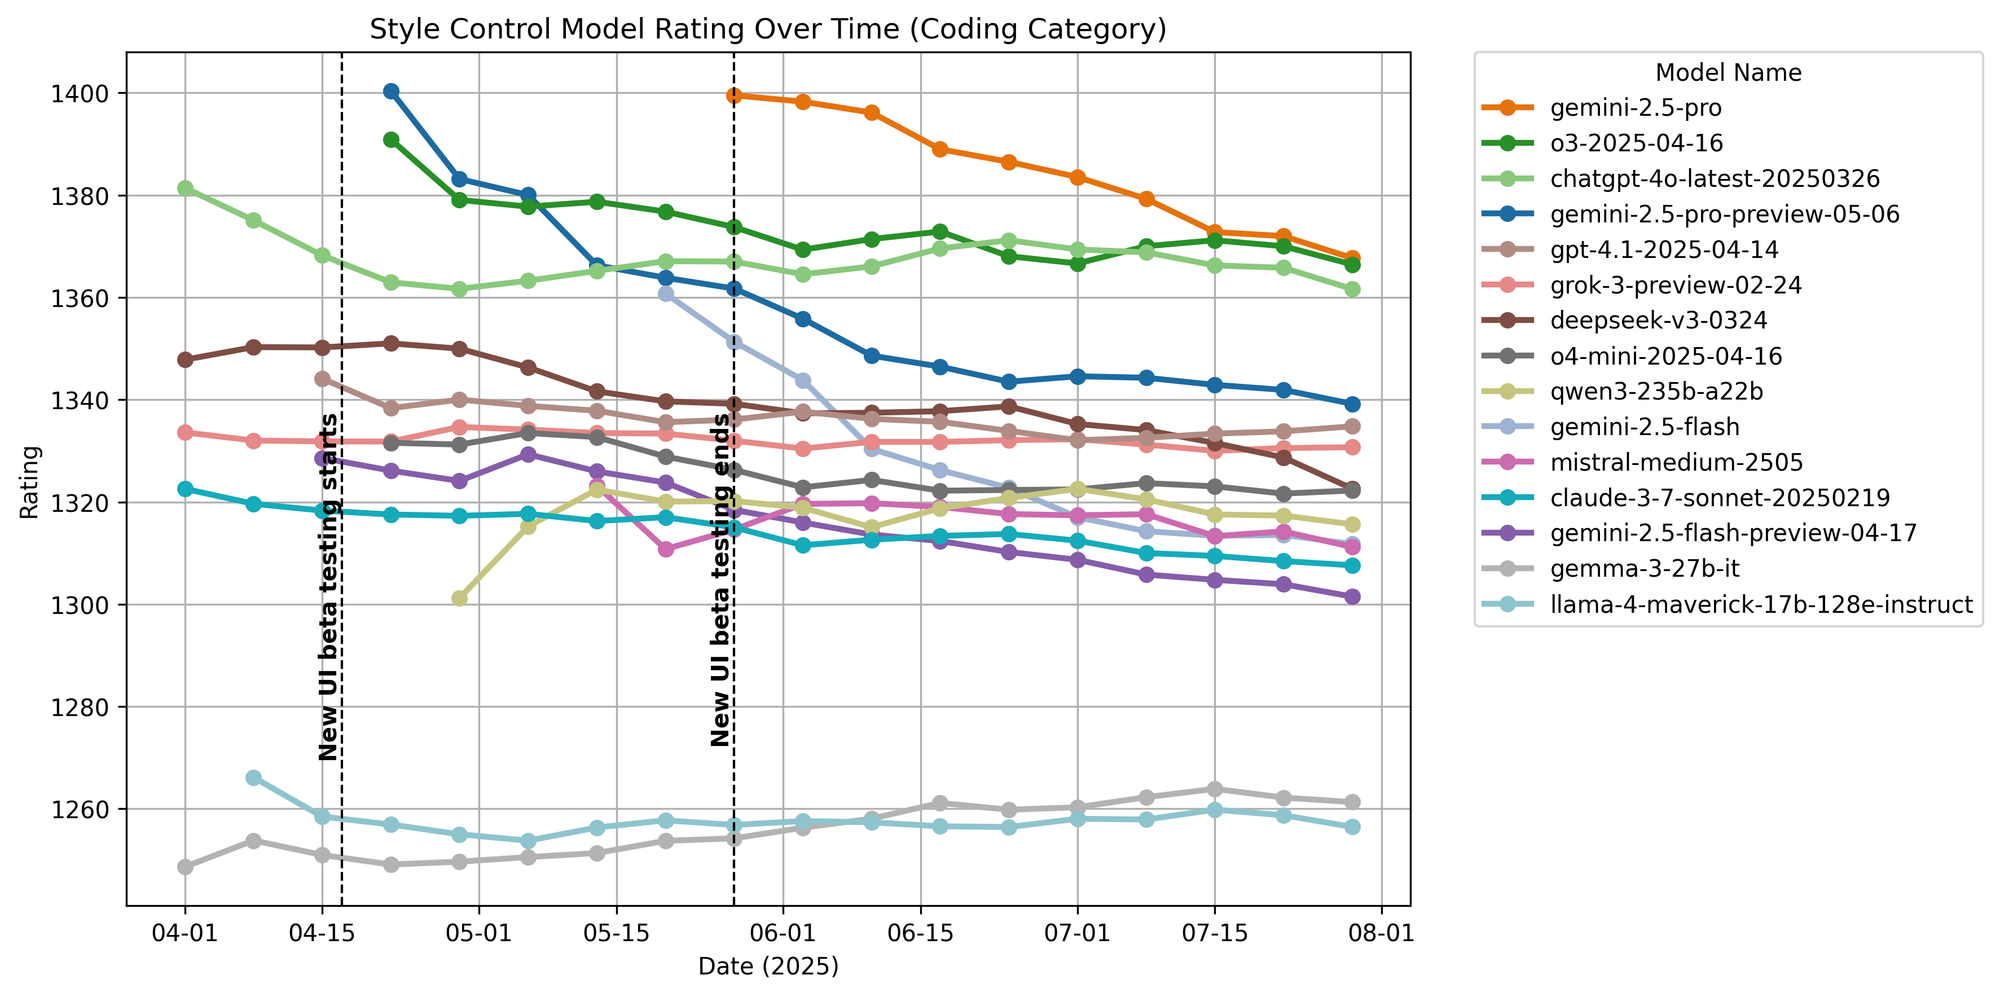
Figure 6. Coding ratings over time.
Creative Writing
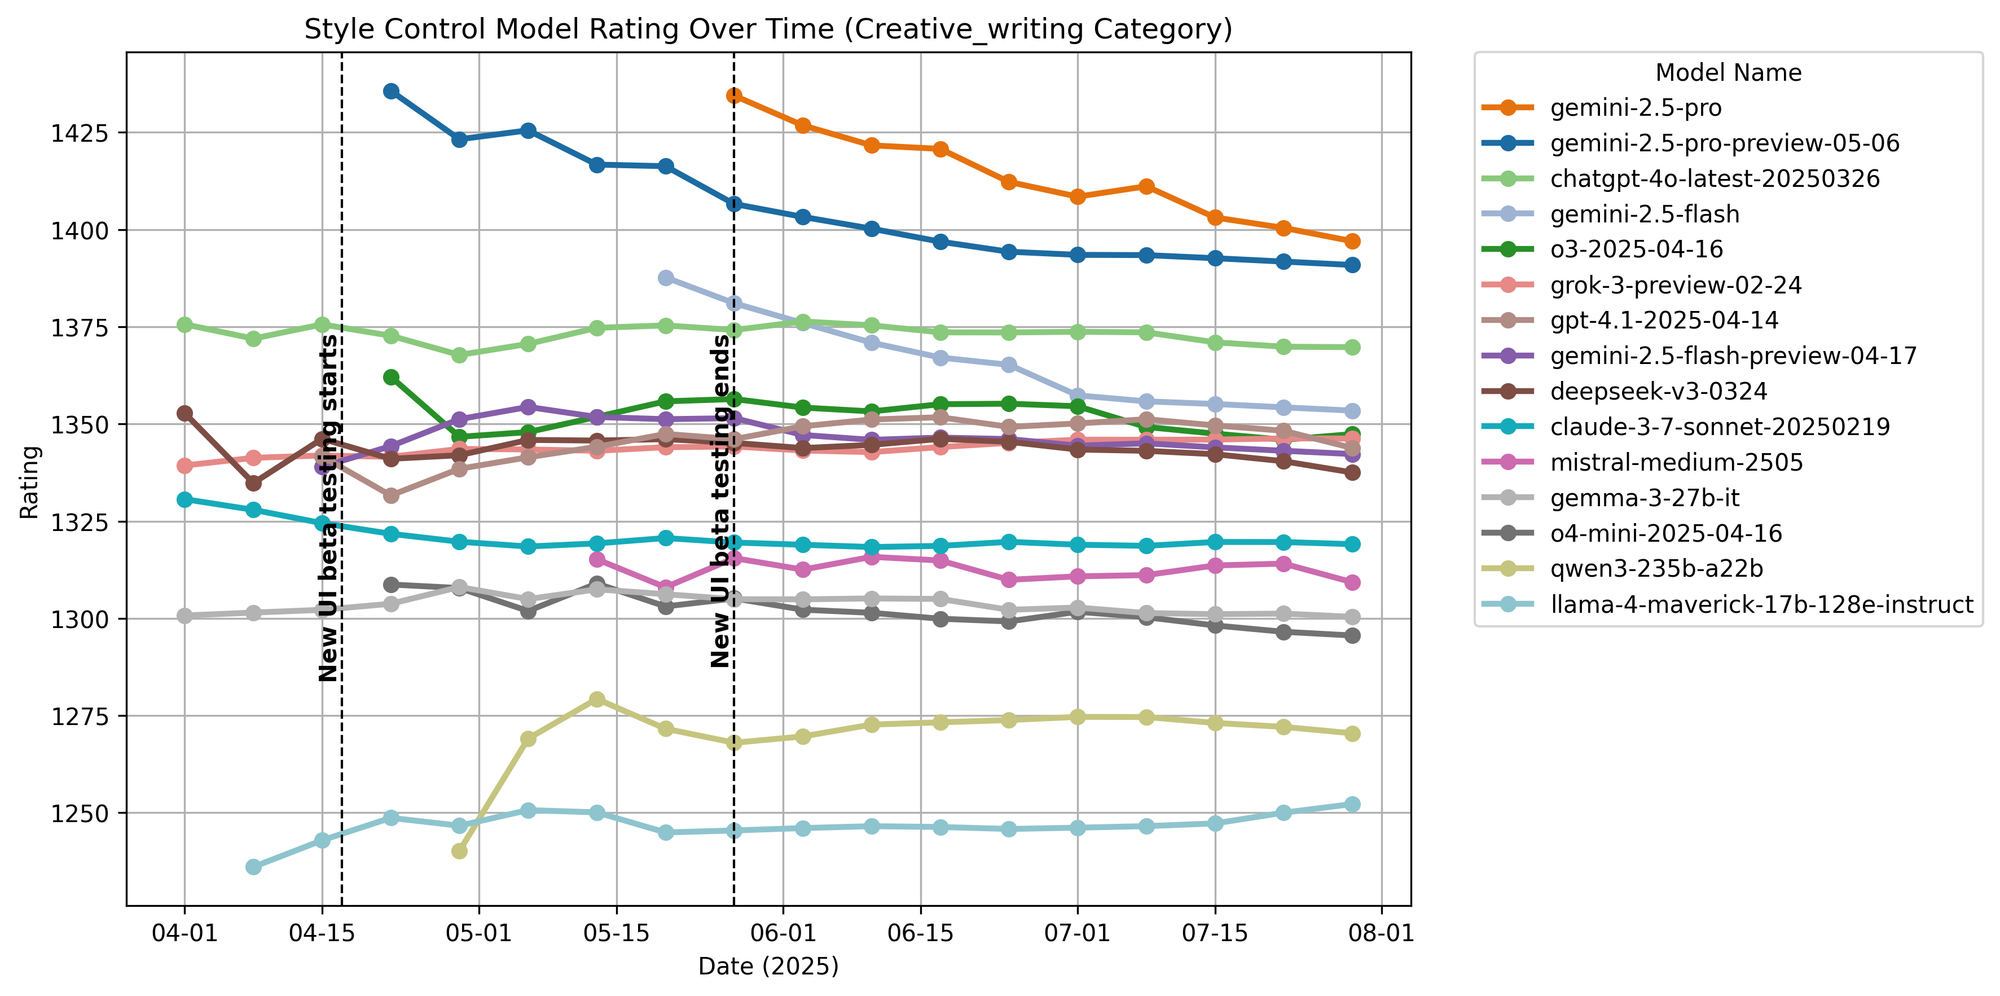
Figure 7. Creative writing ratings over time.
Hard Prompts
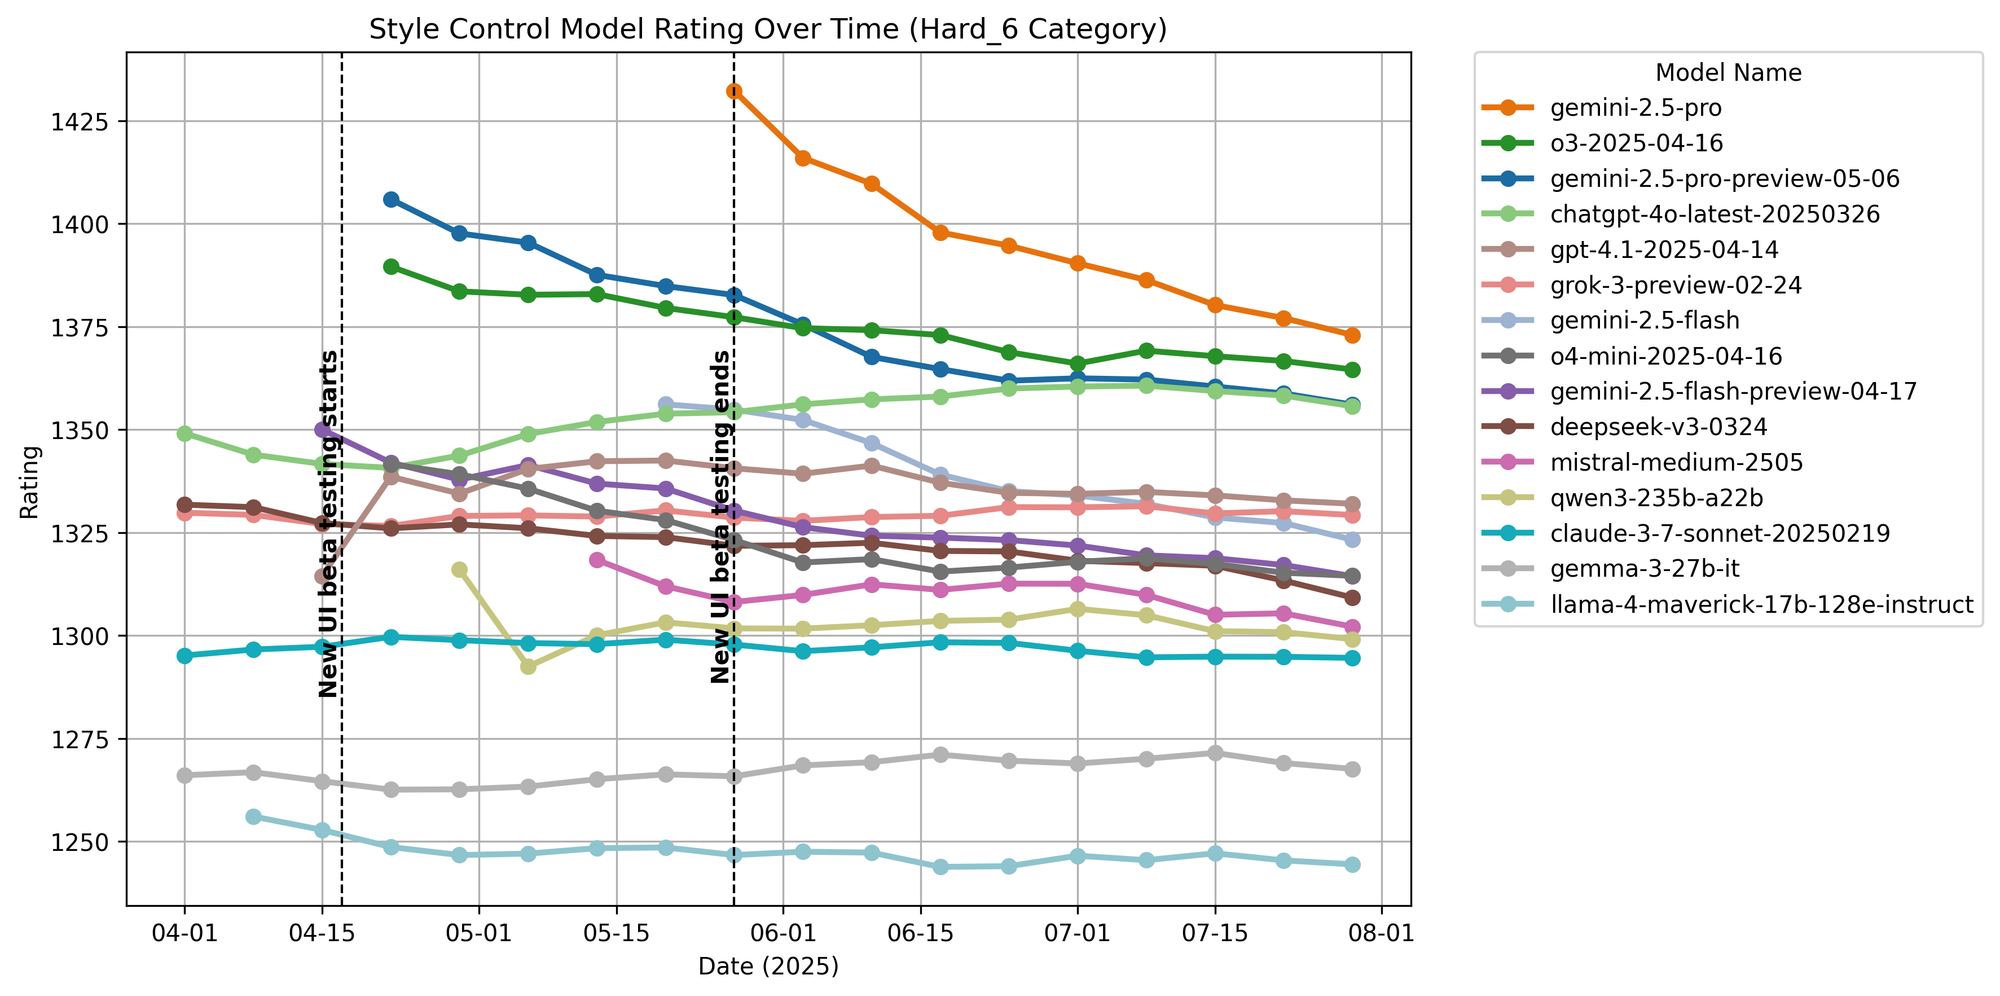
Figure 8. Hard prompt ratings over time.
For score shift graphs for other categories, please refer to the further analysis section.
In addition to shifts in user preference, several other factors also influence score changes.
In the next section, we dive into the main difference between the old and new UI from a data perspective–Evaluation Order, a new feature on the new UI, and a main contributor to the score changes.
For models that show a strong sensitivity to increased evaluation order, we conduct model-specific analysis here. We find that models such as gemini-2.5-flash and gemini-2.5-pro tend to perform better when the evaluation context is restricted to model outputs from the same family.
Evaluation Order
The new UI supports follow-up questions after voting. After a vote is cast and model identities are revealed, a new pair of models will be sampled. To ensure fairness, the winning response from the previous round is passed as context to both models in the next round. If the vote resulted in a tie or a both_bad outcome, then each newly-sampled model instead receives its respective side’s previous response as context.
We formally define the nth evaluation order as the nth vote-casting event within a single evaluation session.
Each evaluation order within a complete evaluation session has its own vote taken into account when leaderboard scores are calculated
The maximum evaluation order in our data is 118. Around 70% of votes have evaluation order equal to one. See Figure 9.
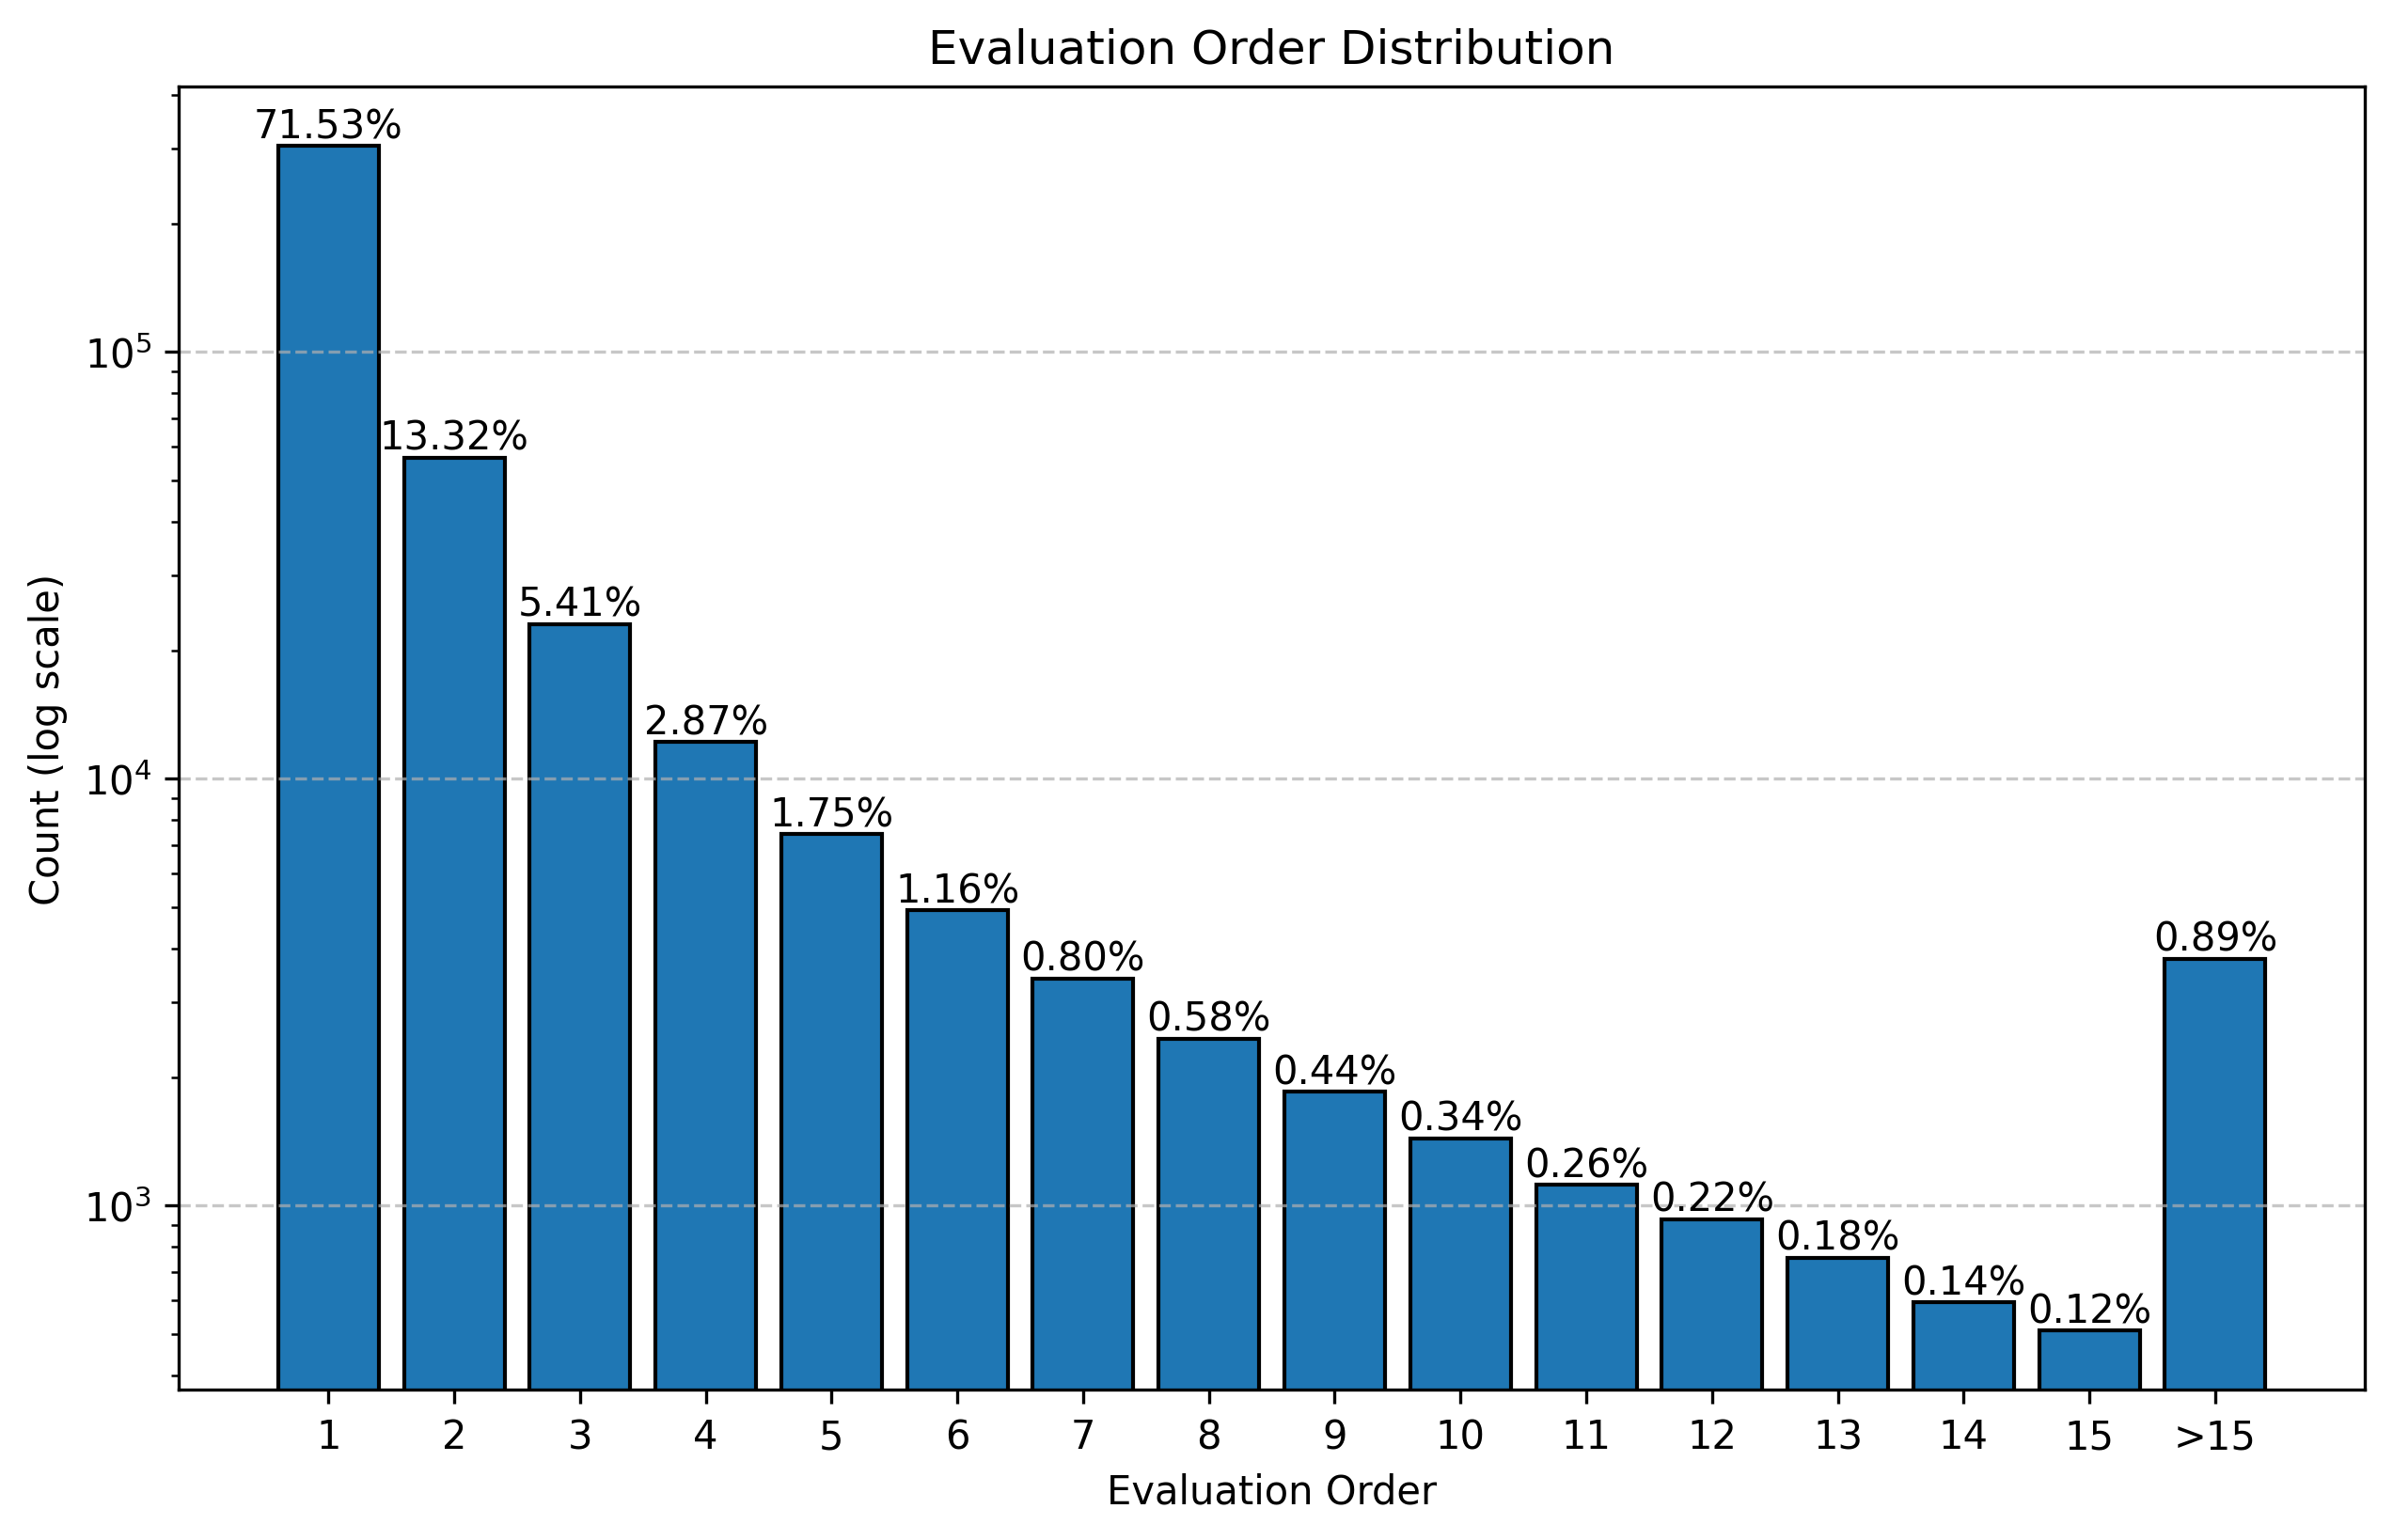
Figure 9. Histogram of evaluation order distribution.
To visualize the effect of evaluation order, in Figure 10 we compare the scores from data where evaluation order is one only with the scores that use all evaluation orders.
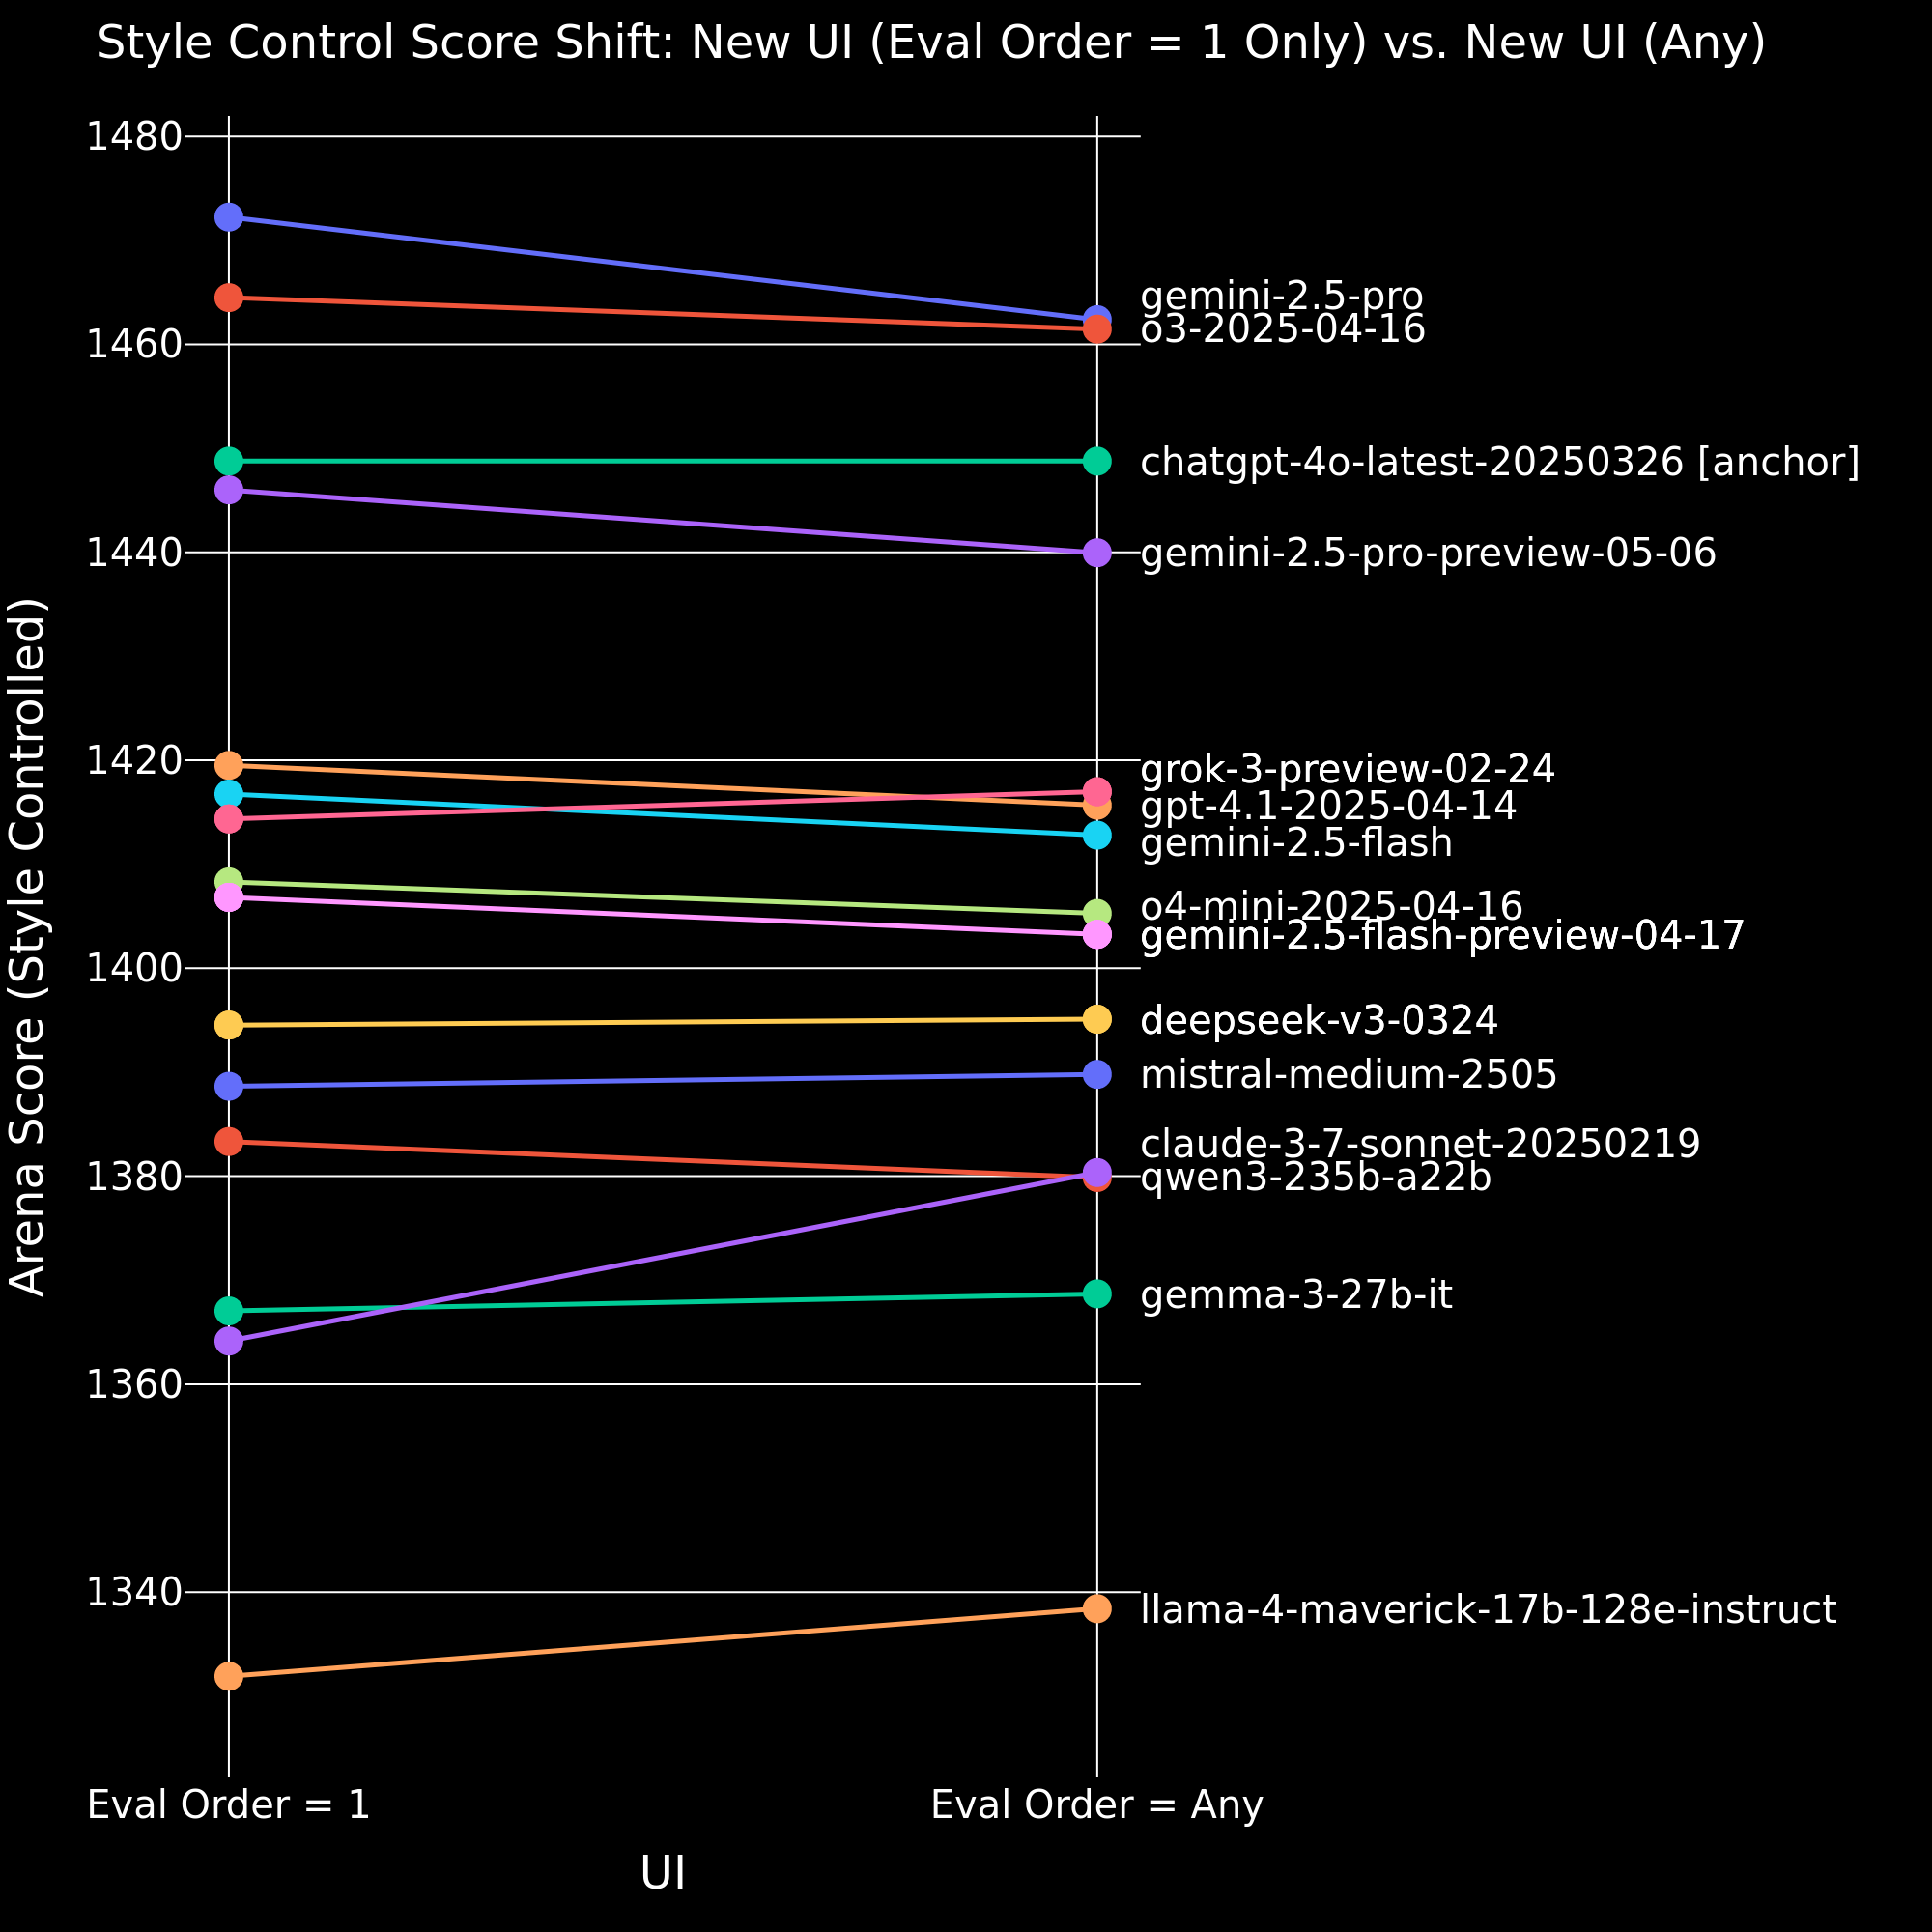
Figure 10. Comparison of style-controlled overall model scores between evaluation order = 1 only and all evaluation orders.
We observe that including all evaluation orders decreases the scores of all Gemini models. Also experiencing a notable decrease are the o4-mini-2025-04-16 , gpt-4.1-2025-04-14 and qwen3-235b-a22b. Claude-3-7-sonnet-20250219 and llama-4-maverick-17b-128e-instruct exhibit a significant increase.
Model-Specific Analysis
A natural question arising from Figure 10 is: why and how are some models' scores affected by evaluation order?
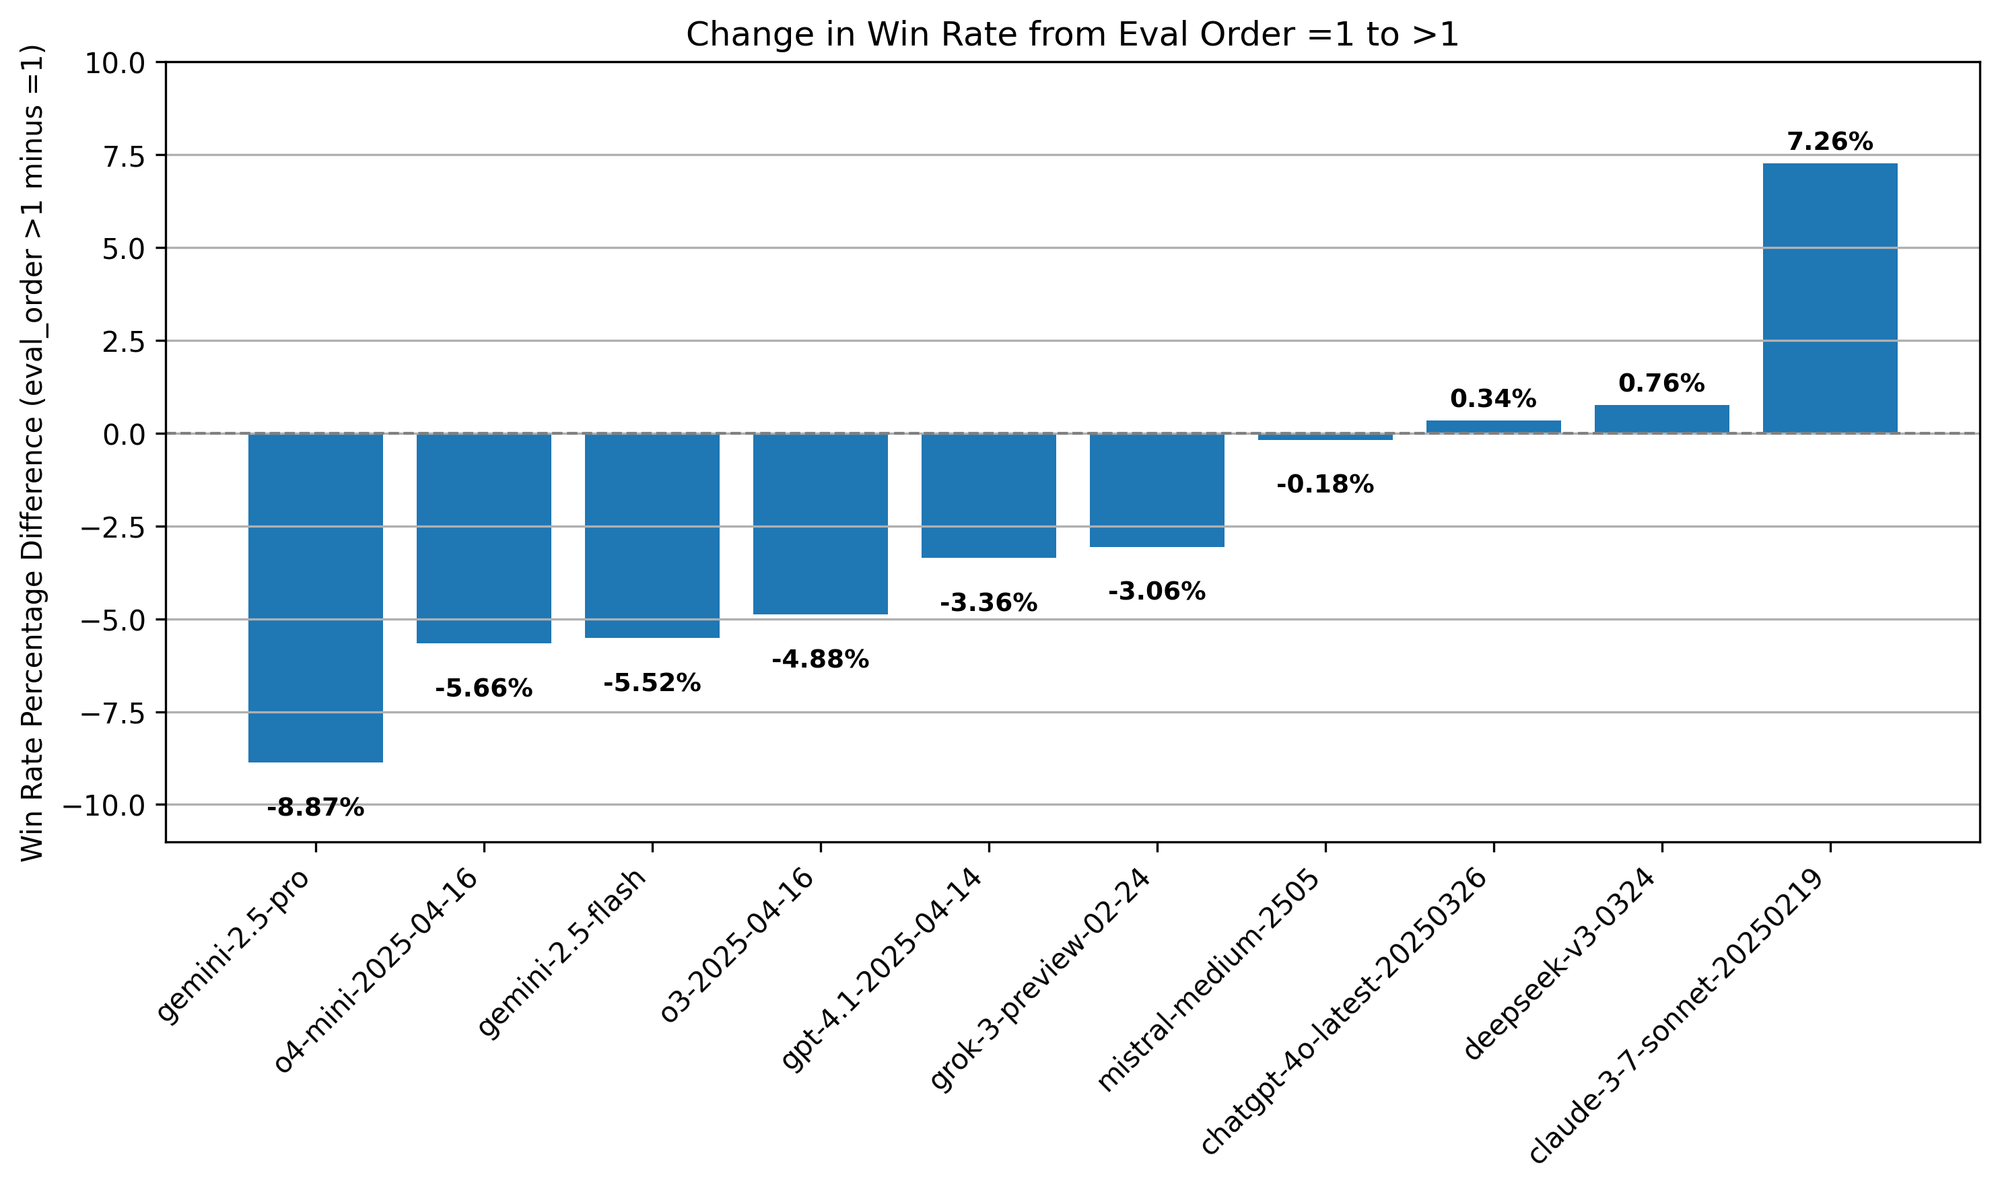
Figure 11. Comparison of change in win rate across evaluation orders and different models.
A Deeper Look into Gemini Models.
All Gemini models experience a notable drop in performance—less wins, more losses—as evaluation order increases beyond one.
For a deeper look into the Gemini models, we divide the data into three groups: evaluation order equal to one, two, and greater than two. We compare the performance of Gemini models under two context conditions: all-context (where the previous context can come from any model) and restricted-context.
In the restricted-context setting, we only include battles where the last context (i.e., the prior winning side) also came from a Gemini model. This ensures that for votes with an evaluation order of two, the context Gemini models received came exclusively from Gemini models. However, votes with evaluation order greater than two may include earlier context turns involving non-Gemini models.
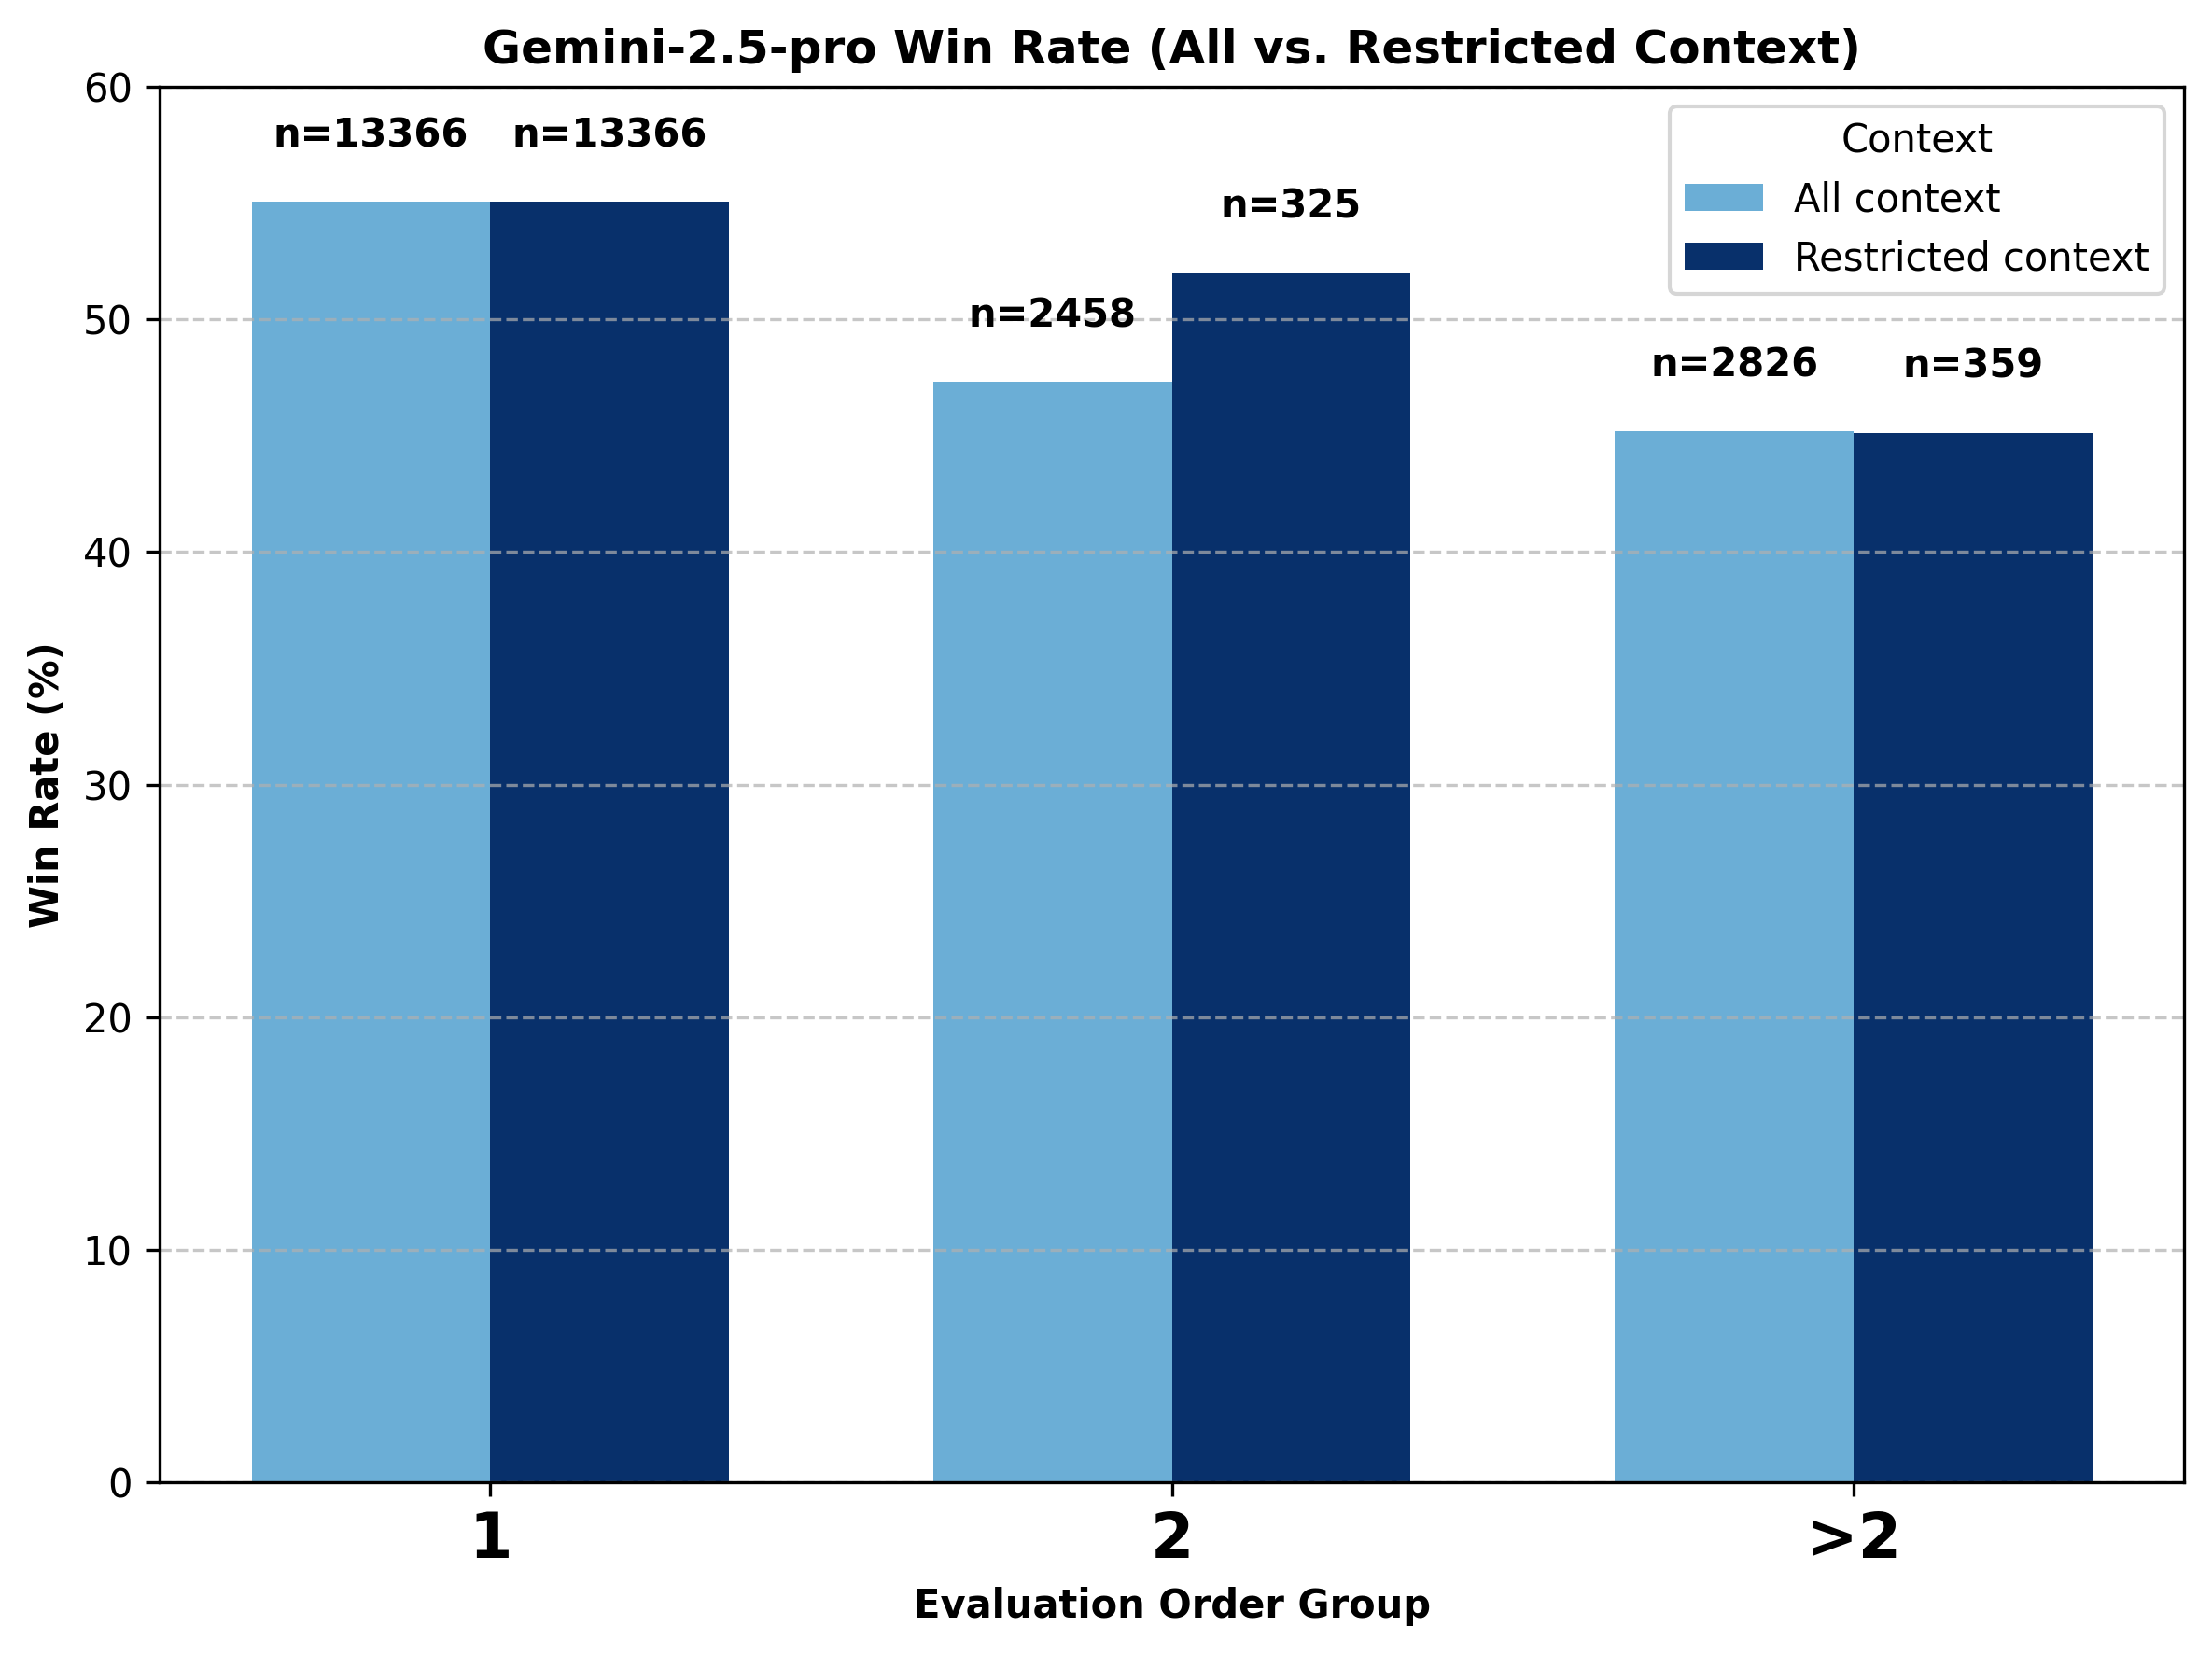
Figure 12. Comparison of change in battle outcome for gemini-2.5-pro under all-context vs. restricted Gemini-only context conditions.
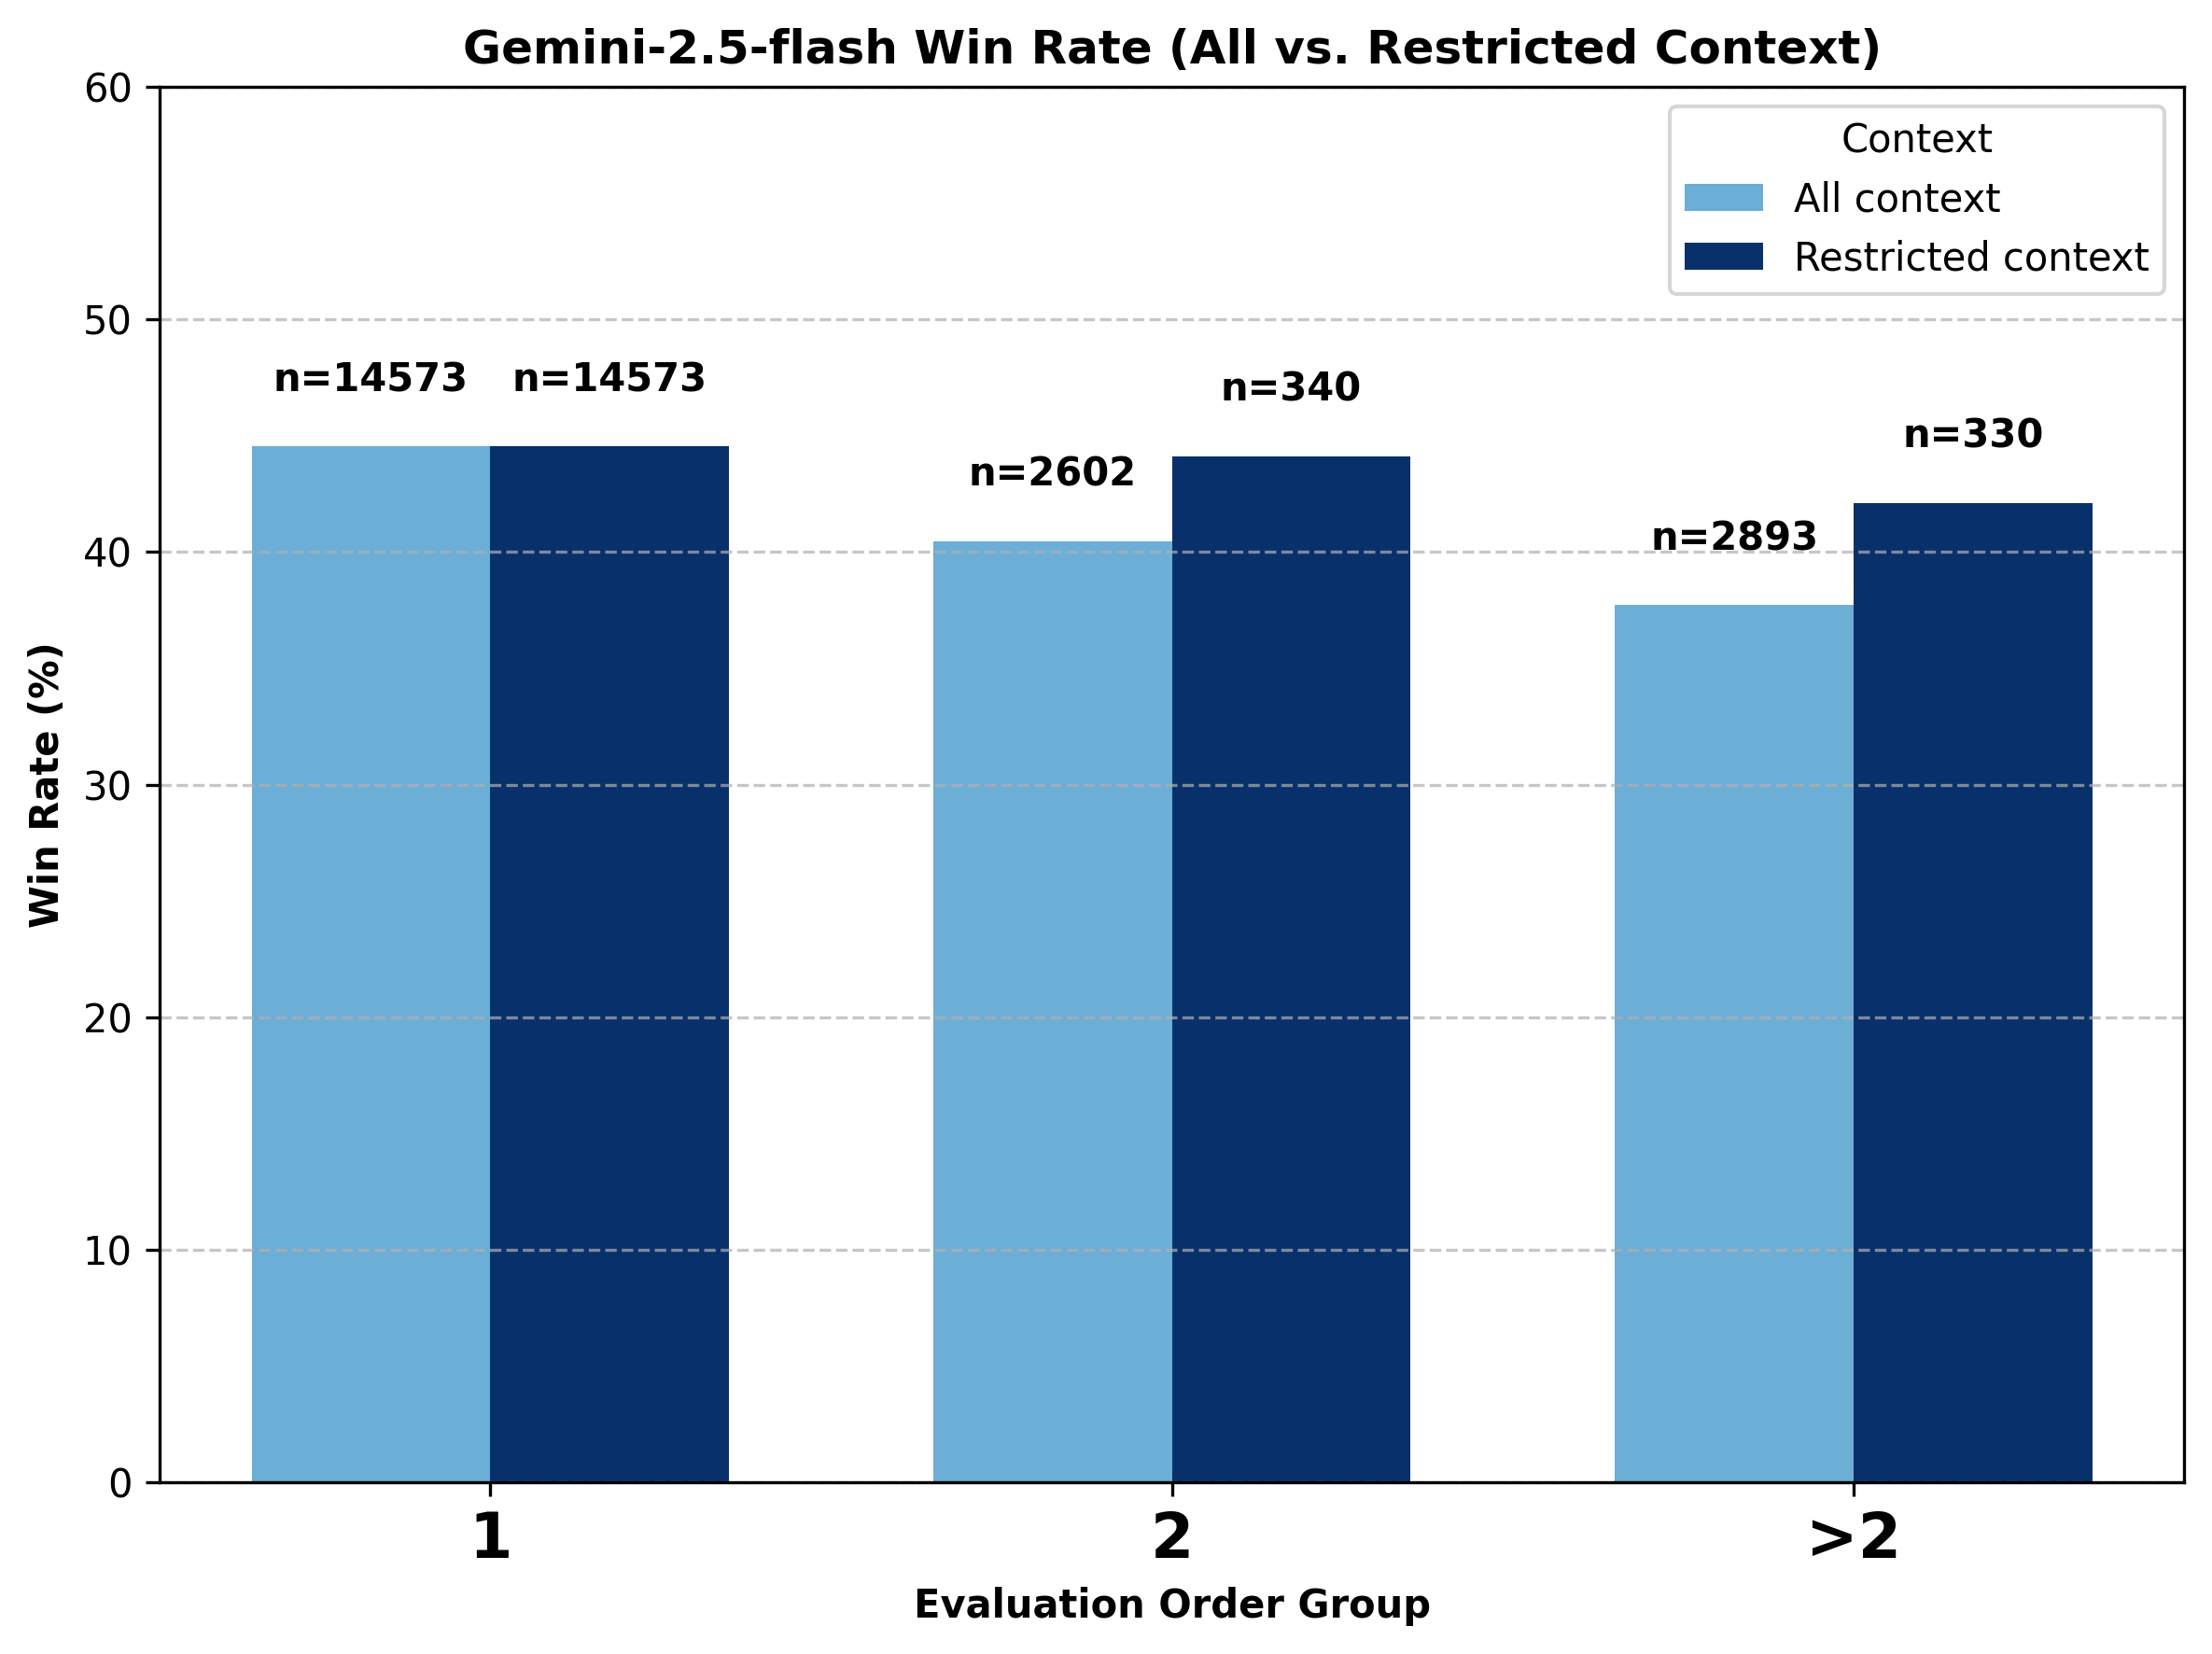
Figure 13. Comparison of change in battle outcome for gemini-2.5-flash under all-context vs. restricted Gemini-only context conditions.
Notably, when the context is restricted to Gemini-only, gemini-2.5-pro shows a much smaller decline going from evaluation order one to two compared to all context, and gemini-2.5-flash shows an even smaller decline. Overall, both models perform better at higher evaluation orders when the incoming context comes from other Gemini models. This suggests that Gemini models perform better when their context contains outputs primarily from other Gemini models.
A Deeper Look into GPT Models.
While o4-mini and o3 both experience notable declines when evaluation order increases to above one, chatgpt-4o-latest's performance barely changes. Following the same approach used in the Gemini analysis, we divide the data into three groups—evaluation order equal to one, two, and greater than two—and compare the performance shifts for these models under both all-context (where prior context can come from any model) and restricted-context (where the previous winning model is limited to the same model family). We observe mixed results even with restricted context: the win rates sometimes increase and sometimes decrease as evaluation order increases.
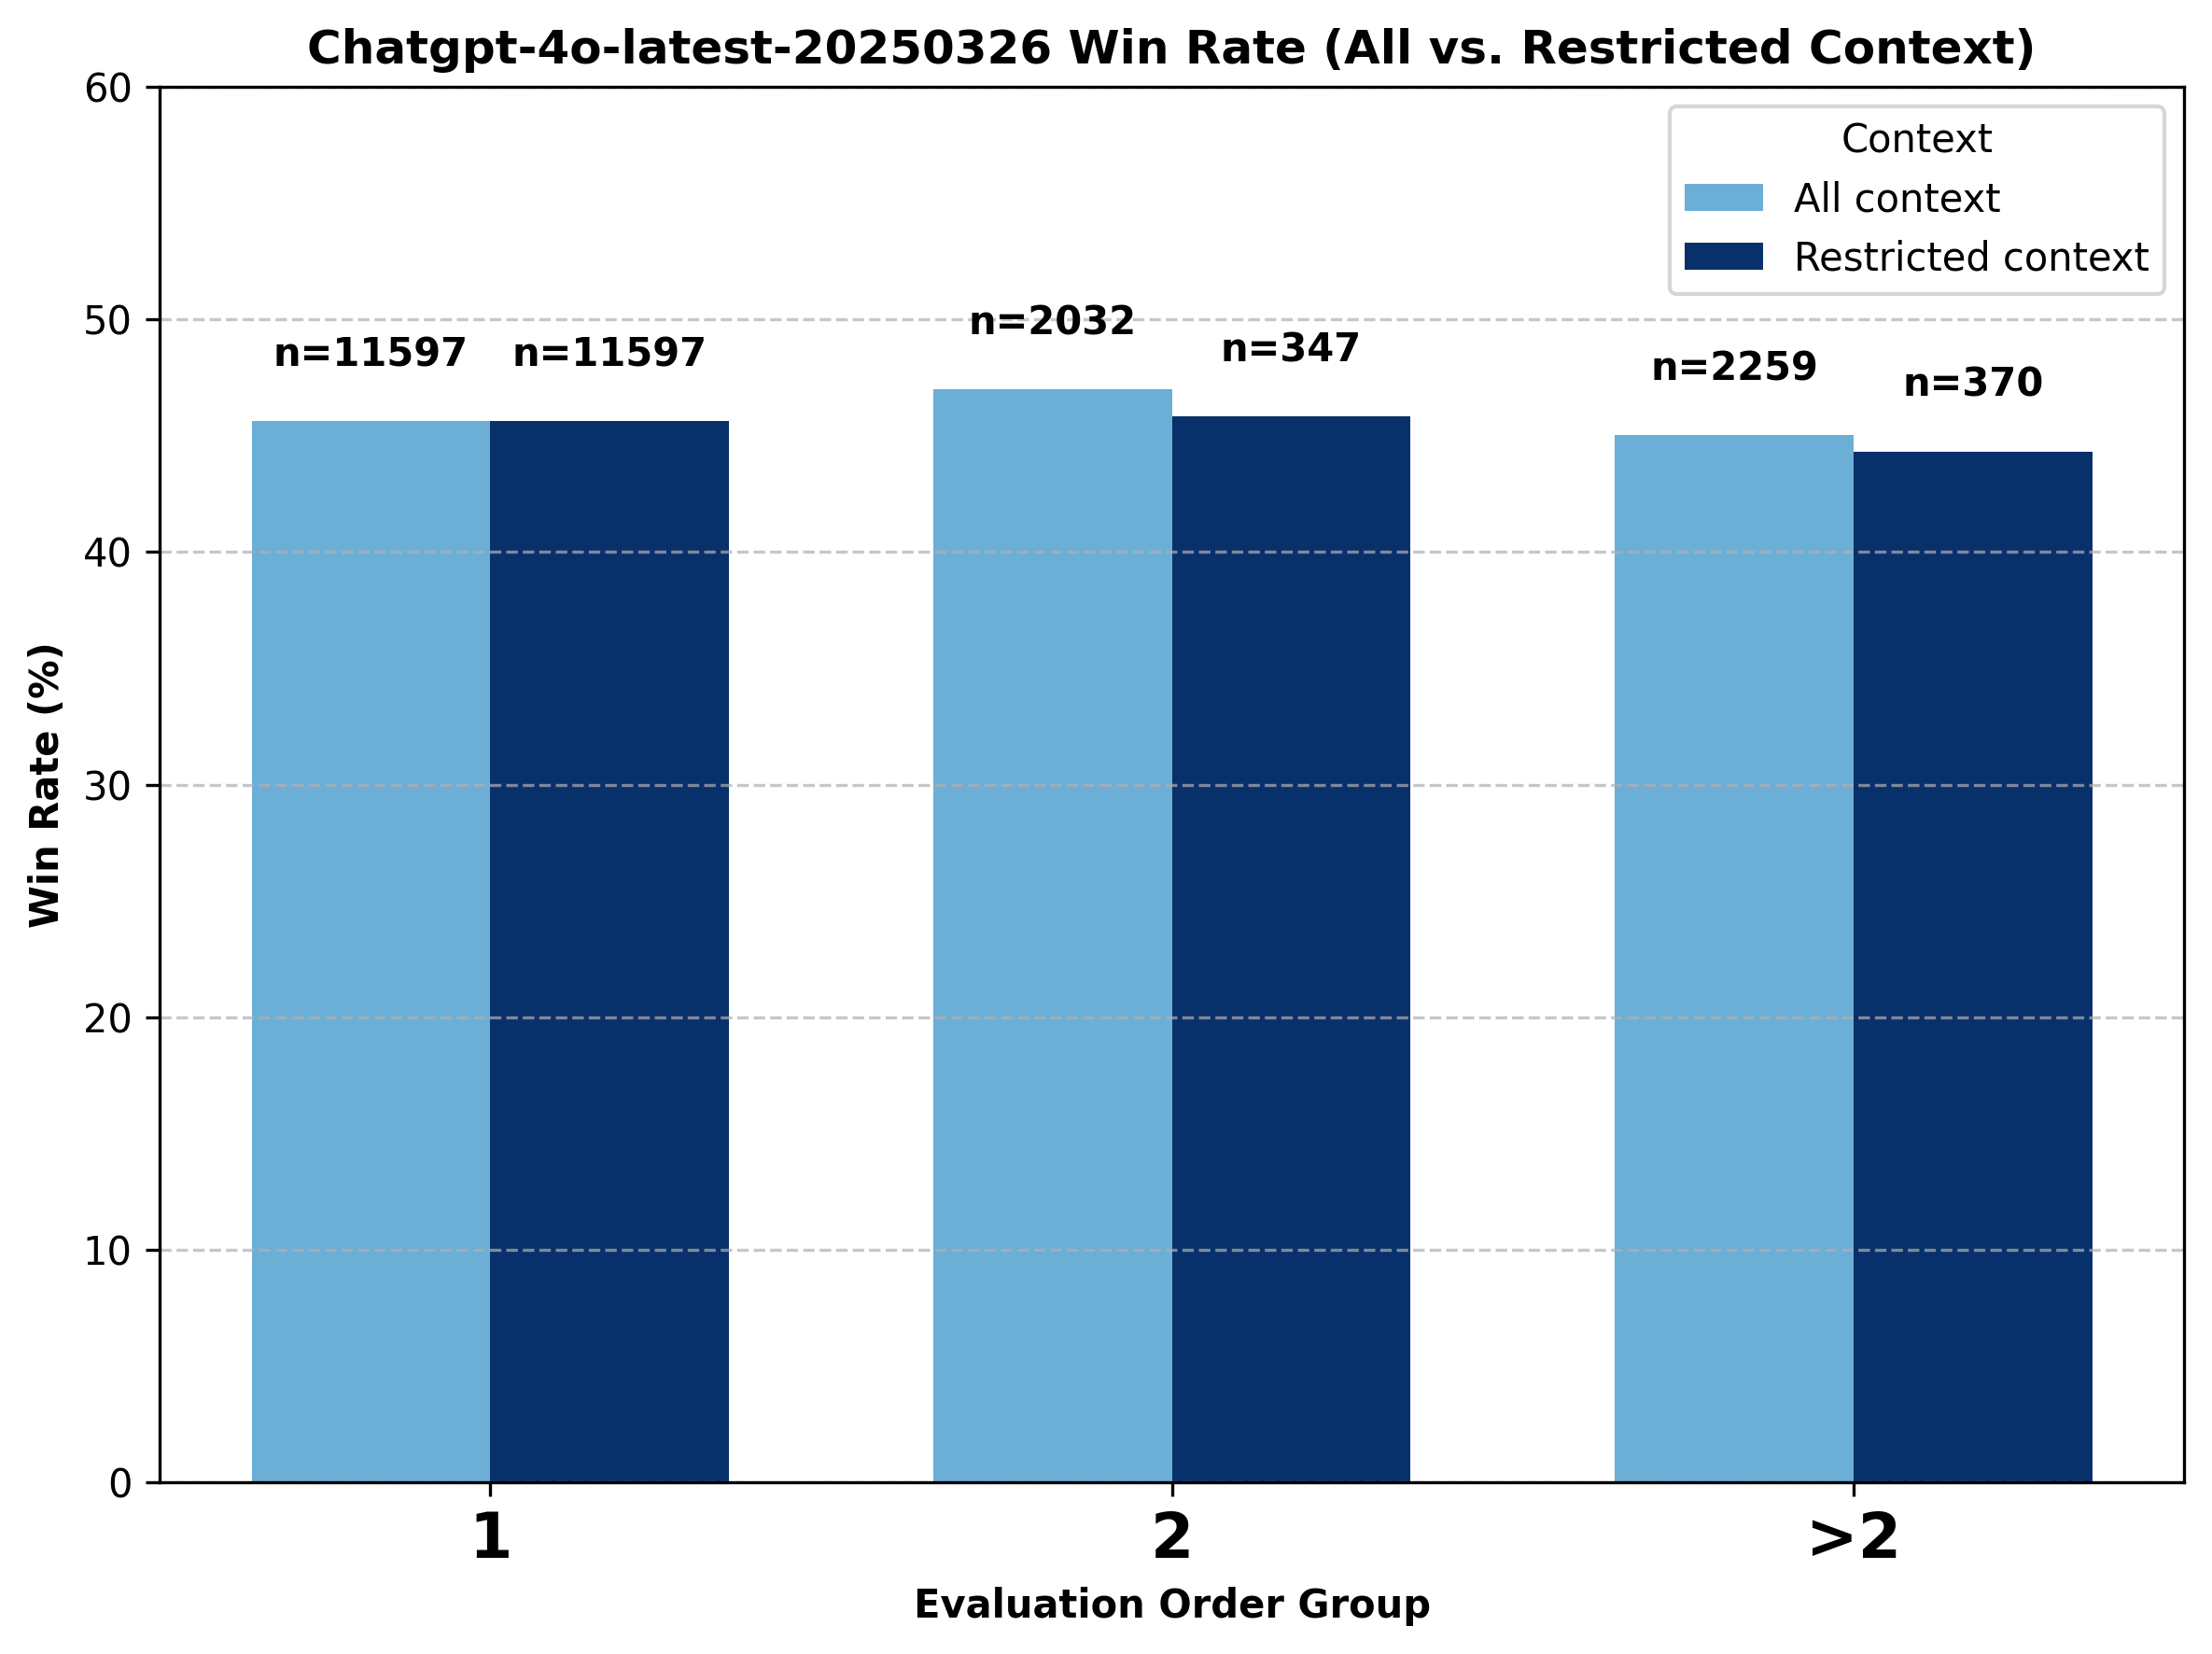
Figure 14. Comparison of change in battle outcome for chatgpt-4o-latest under all-context vs. restricted GPT-only context conditions.
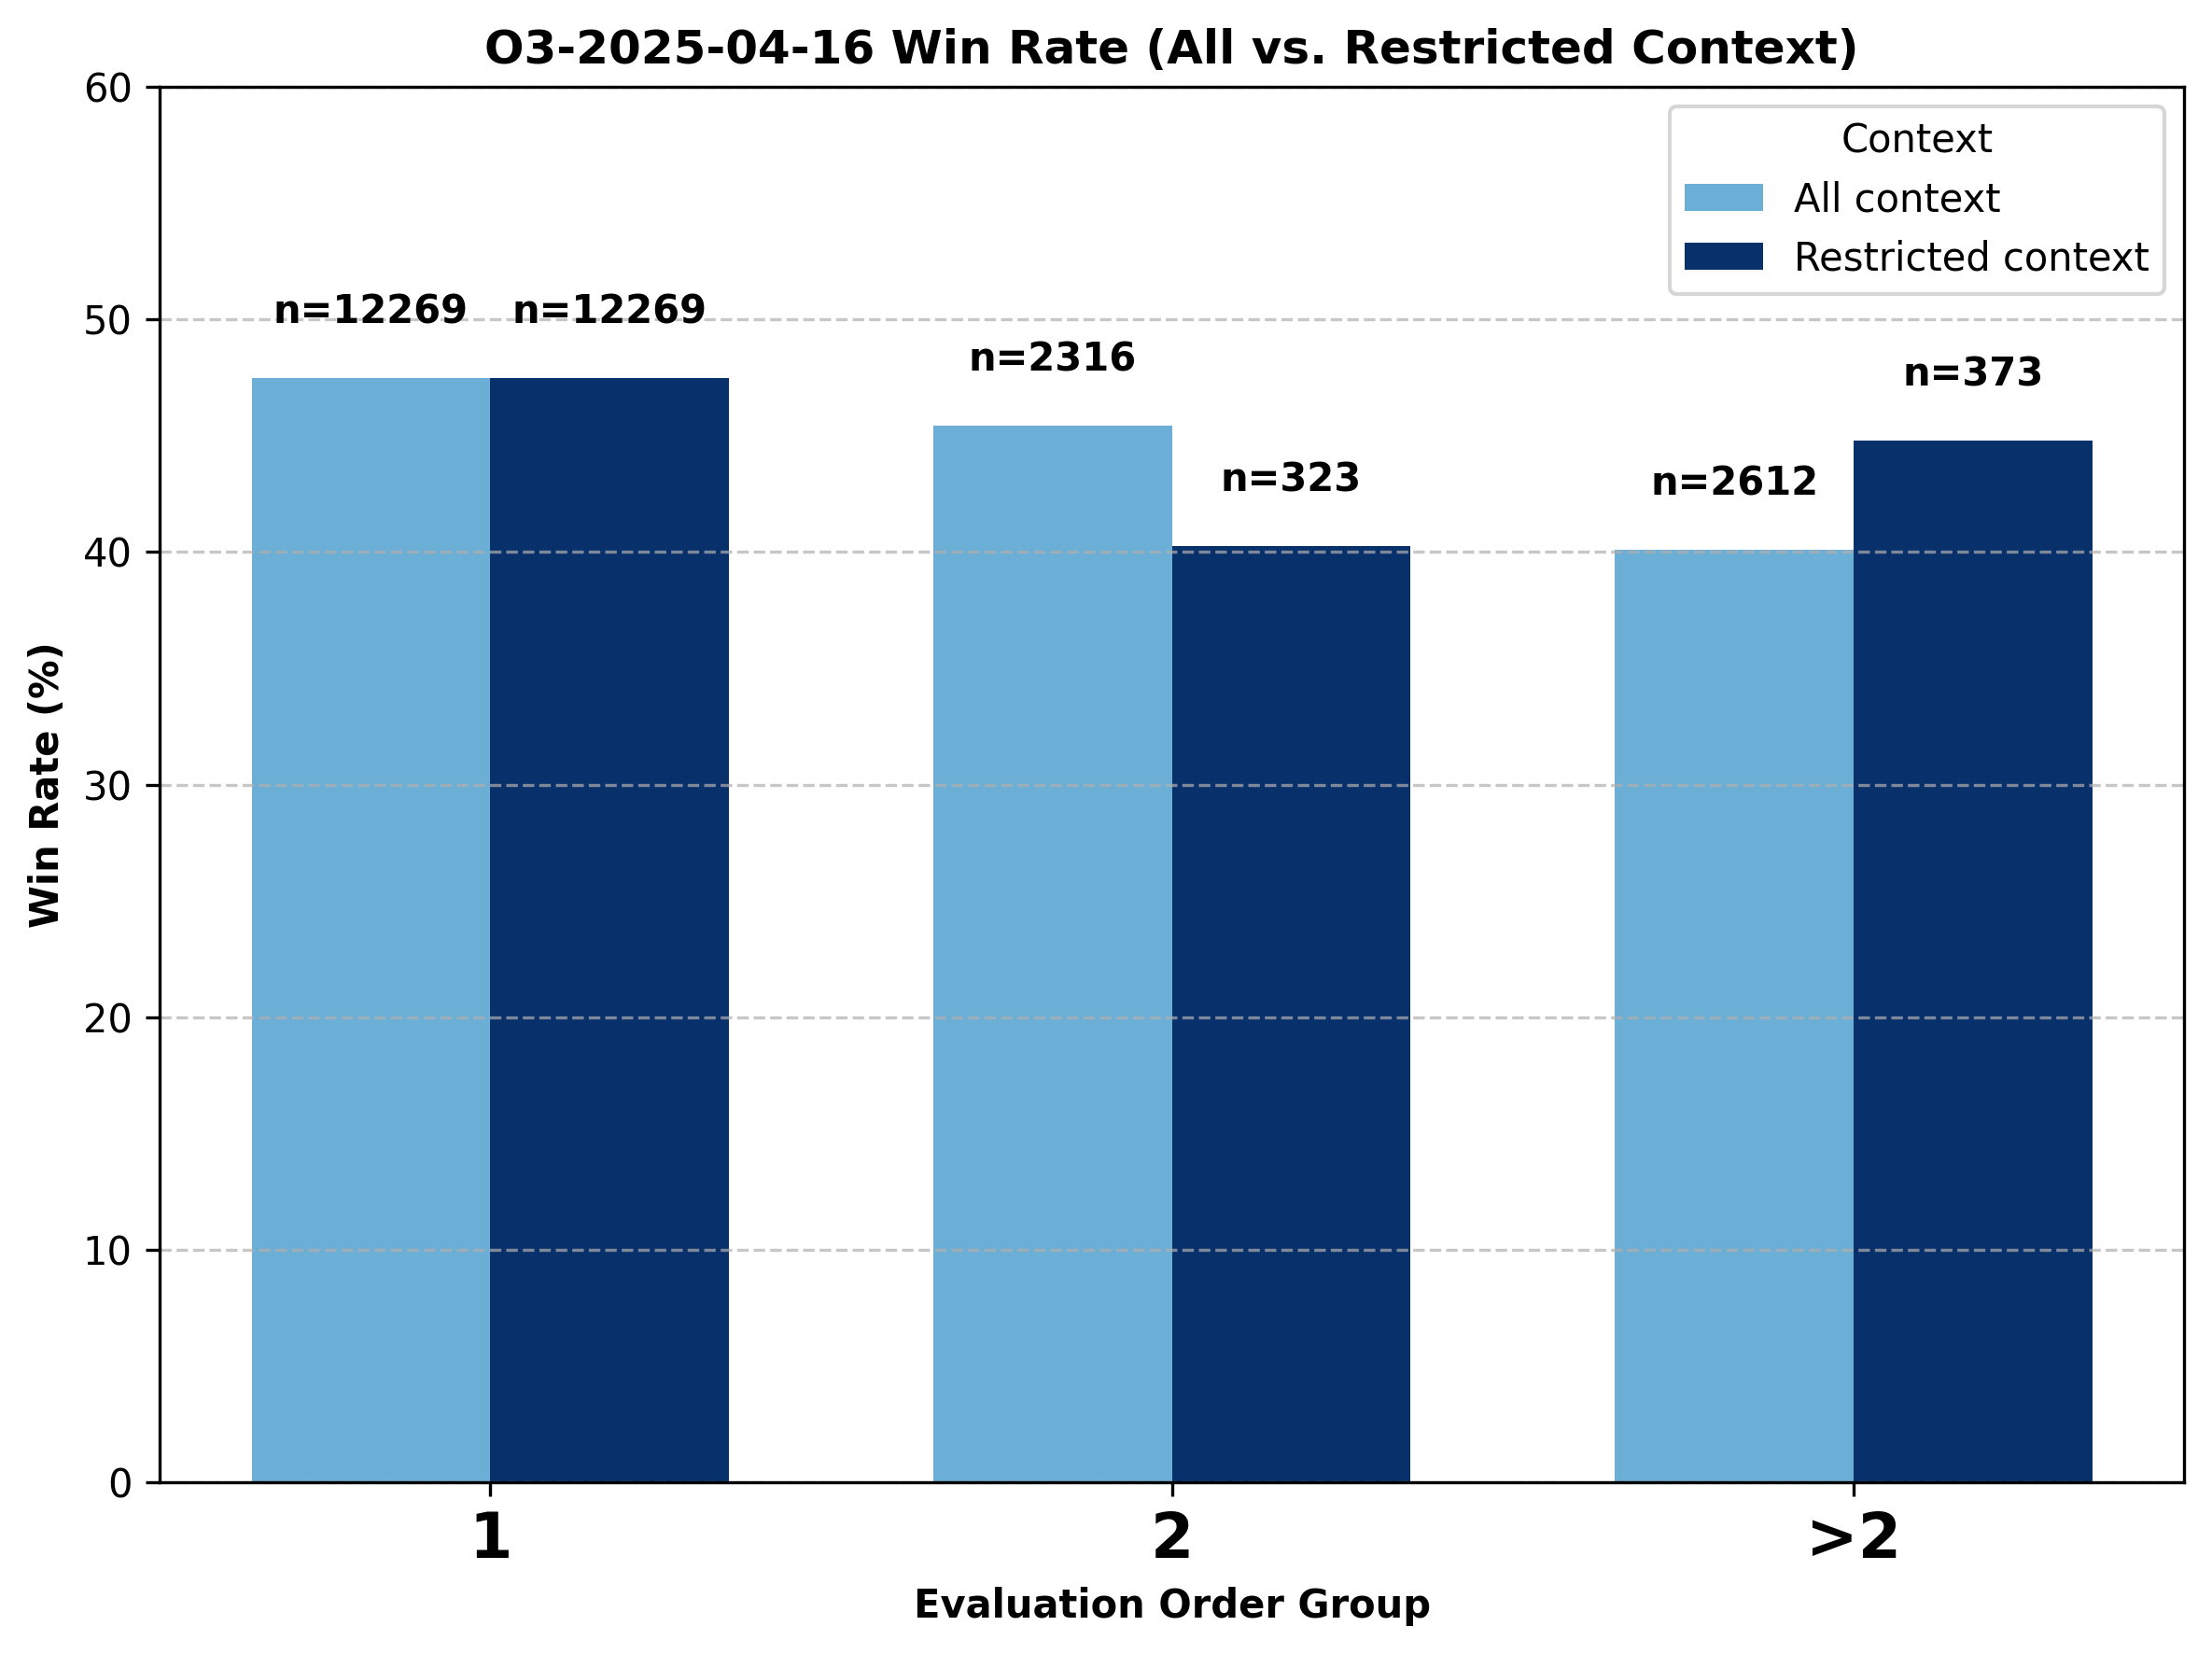
Figure 15. Comparison of change in battle outcome for o3 under all-context vs. restricted GPT-only context conditions.
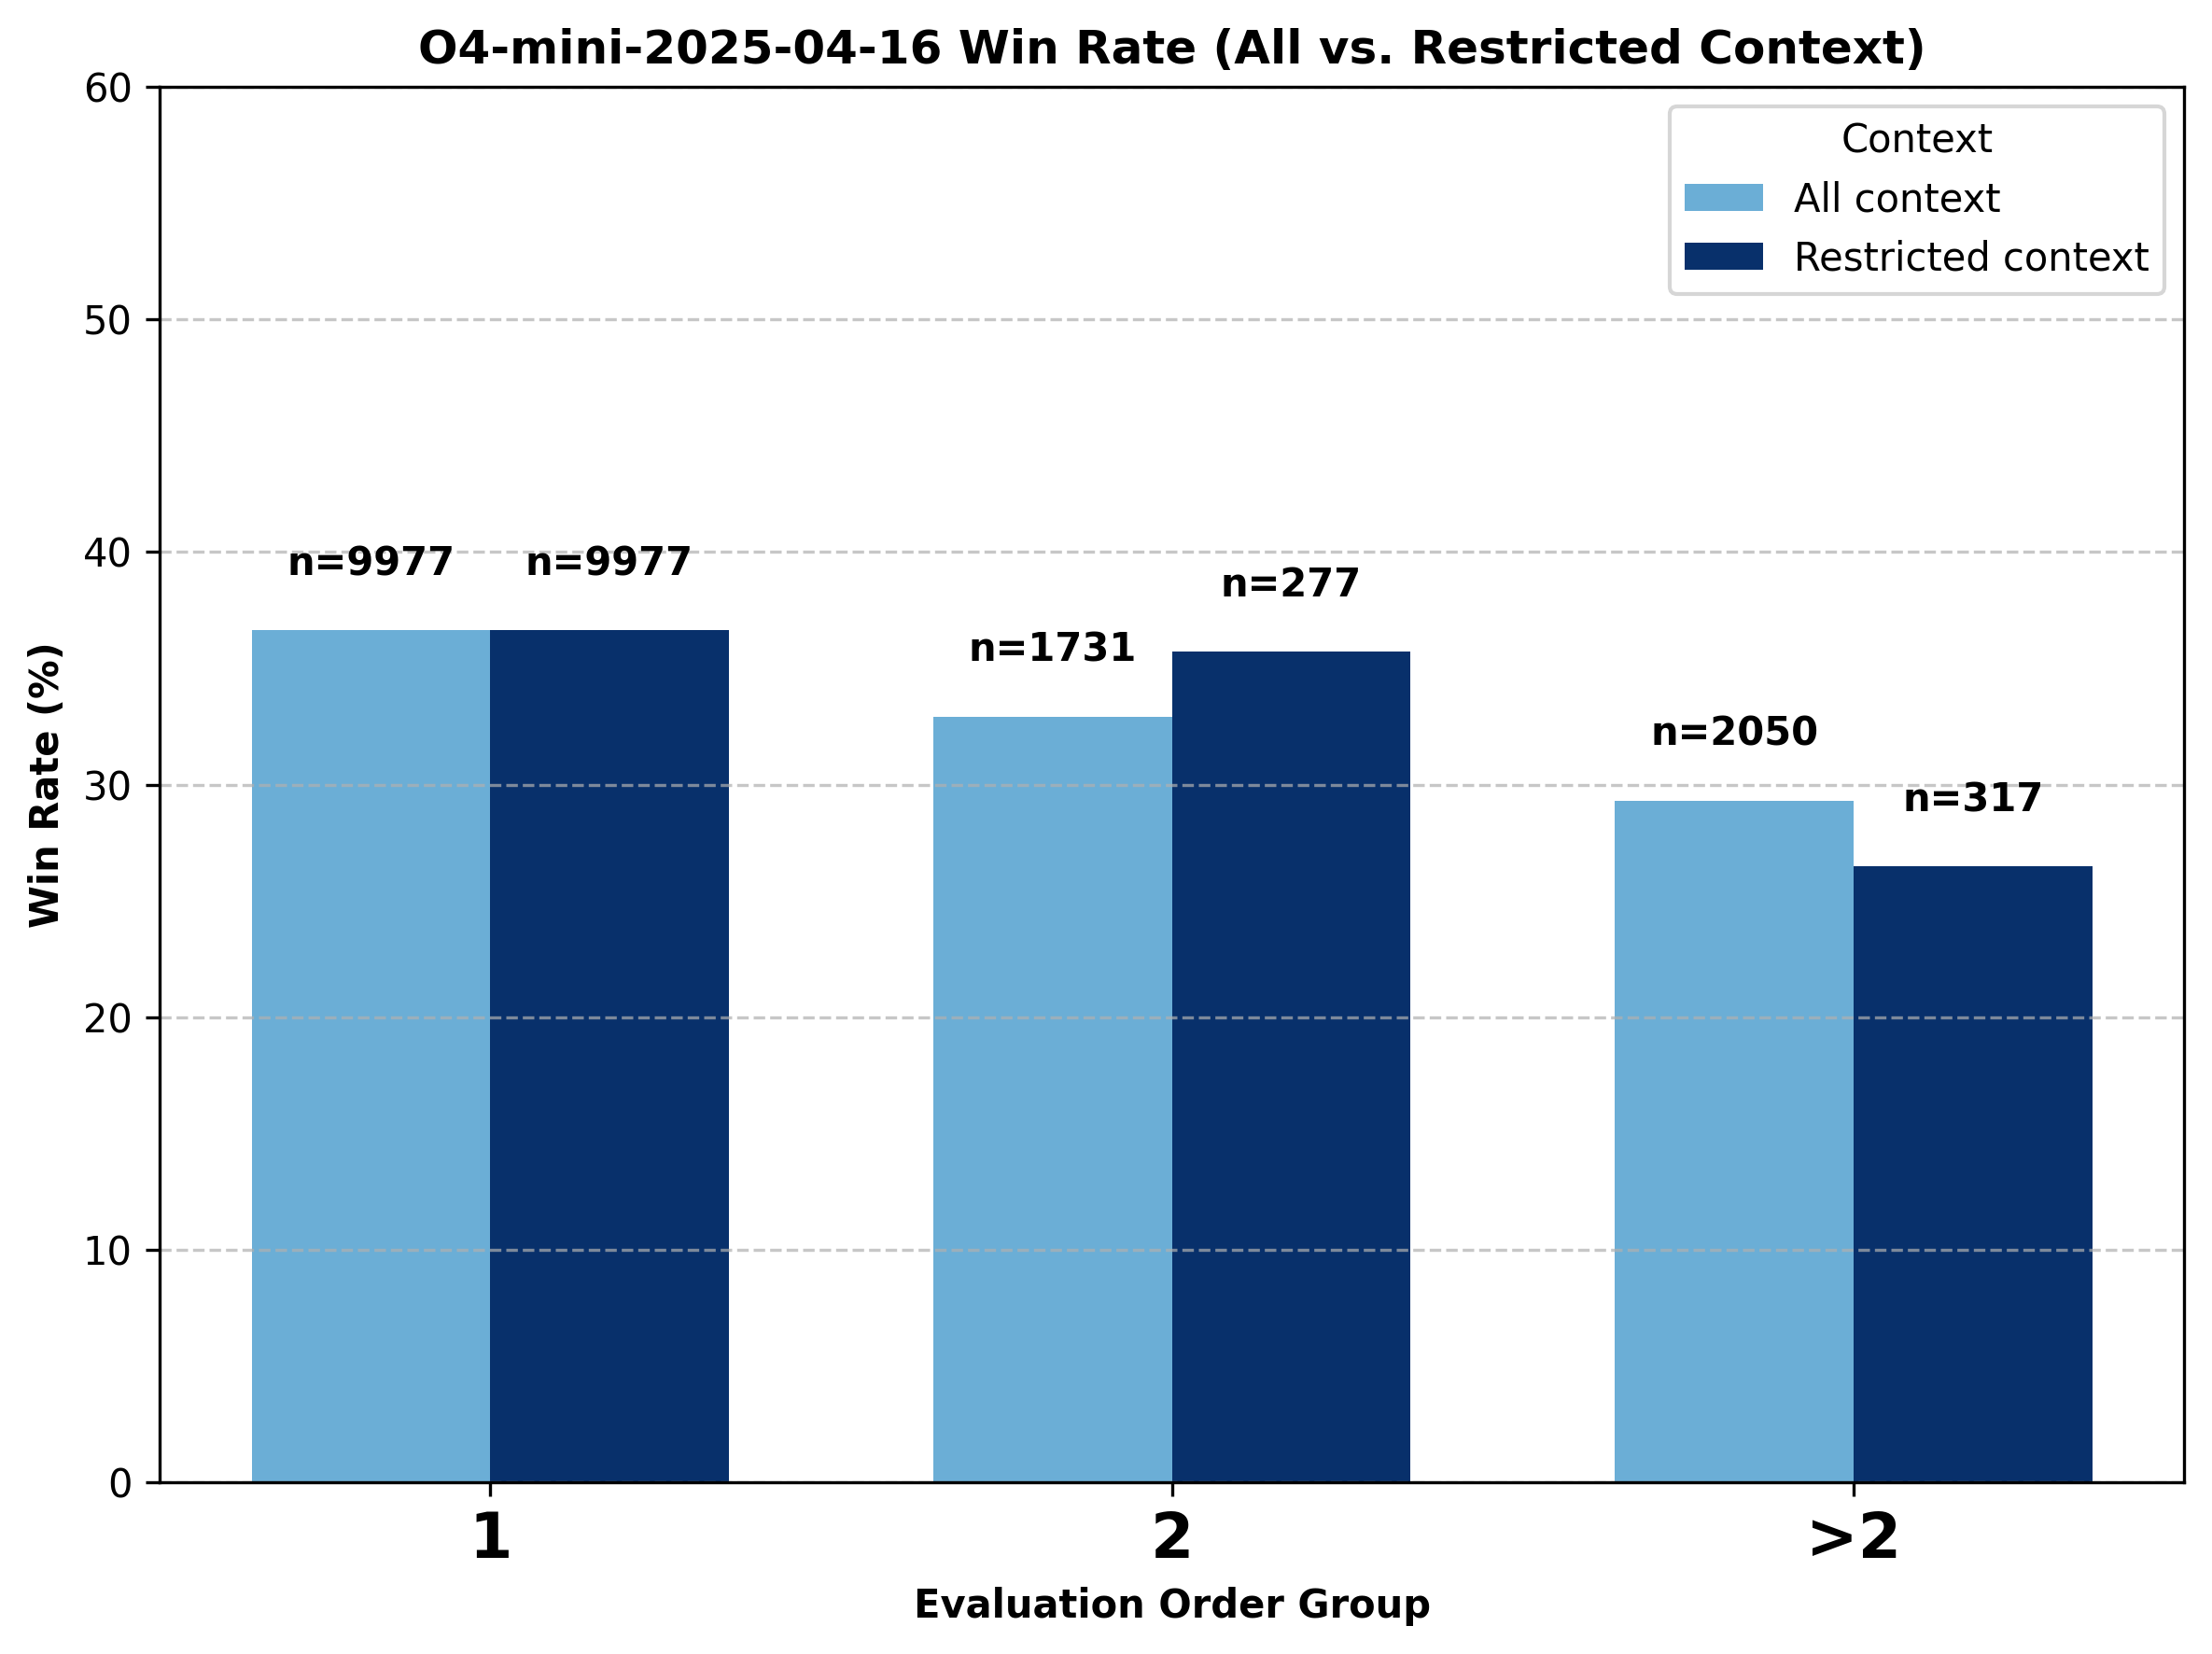
Figure 16. Comparison of change in battle outcome for o4-mini under all-context vs. restricted GPT-only context conditions.
A Deeper Look into Claude-3-7-Sonnet.
Claude-3-7-sonnet experiences a notable increase in performance as evaluation order increases to above one, unlike most other models. We perform the same analysis here as for the previous families of models.
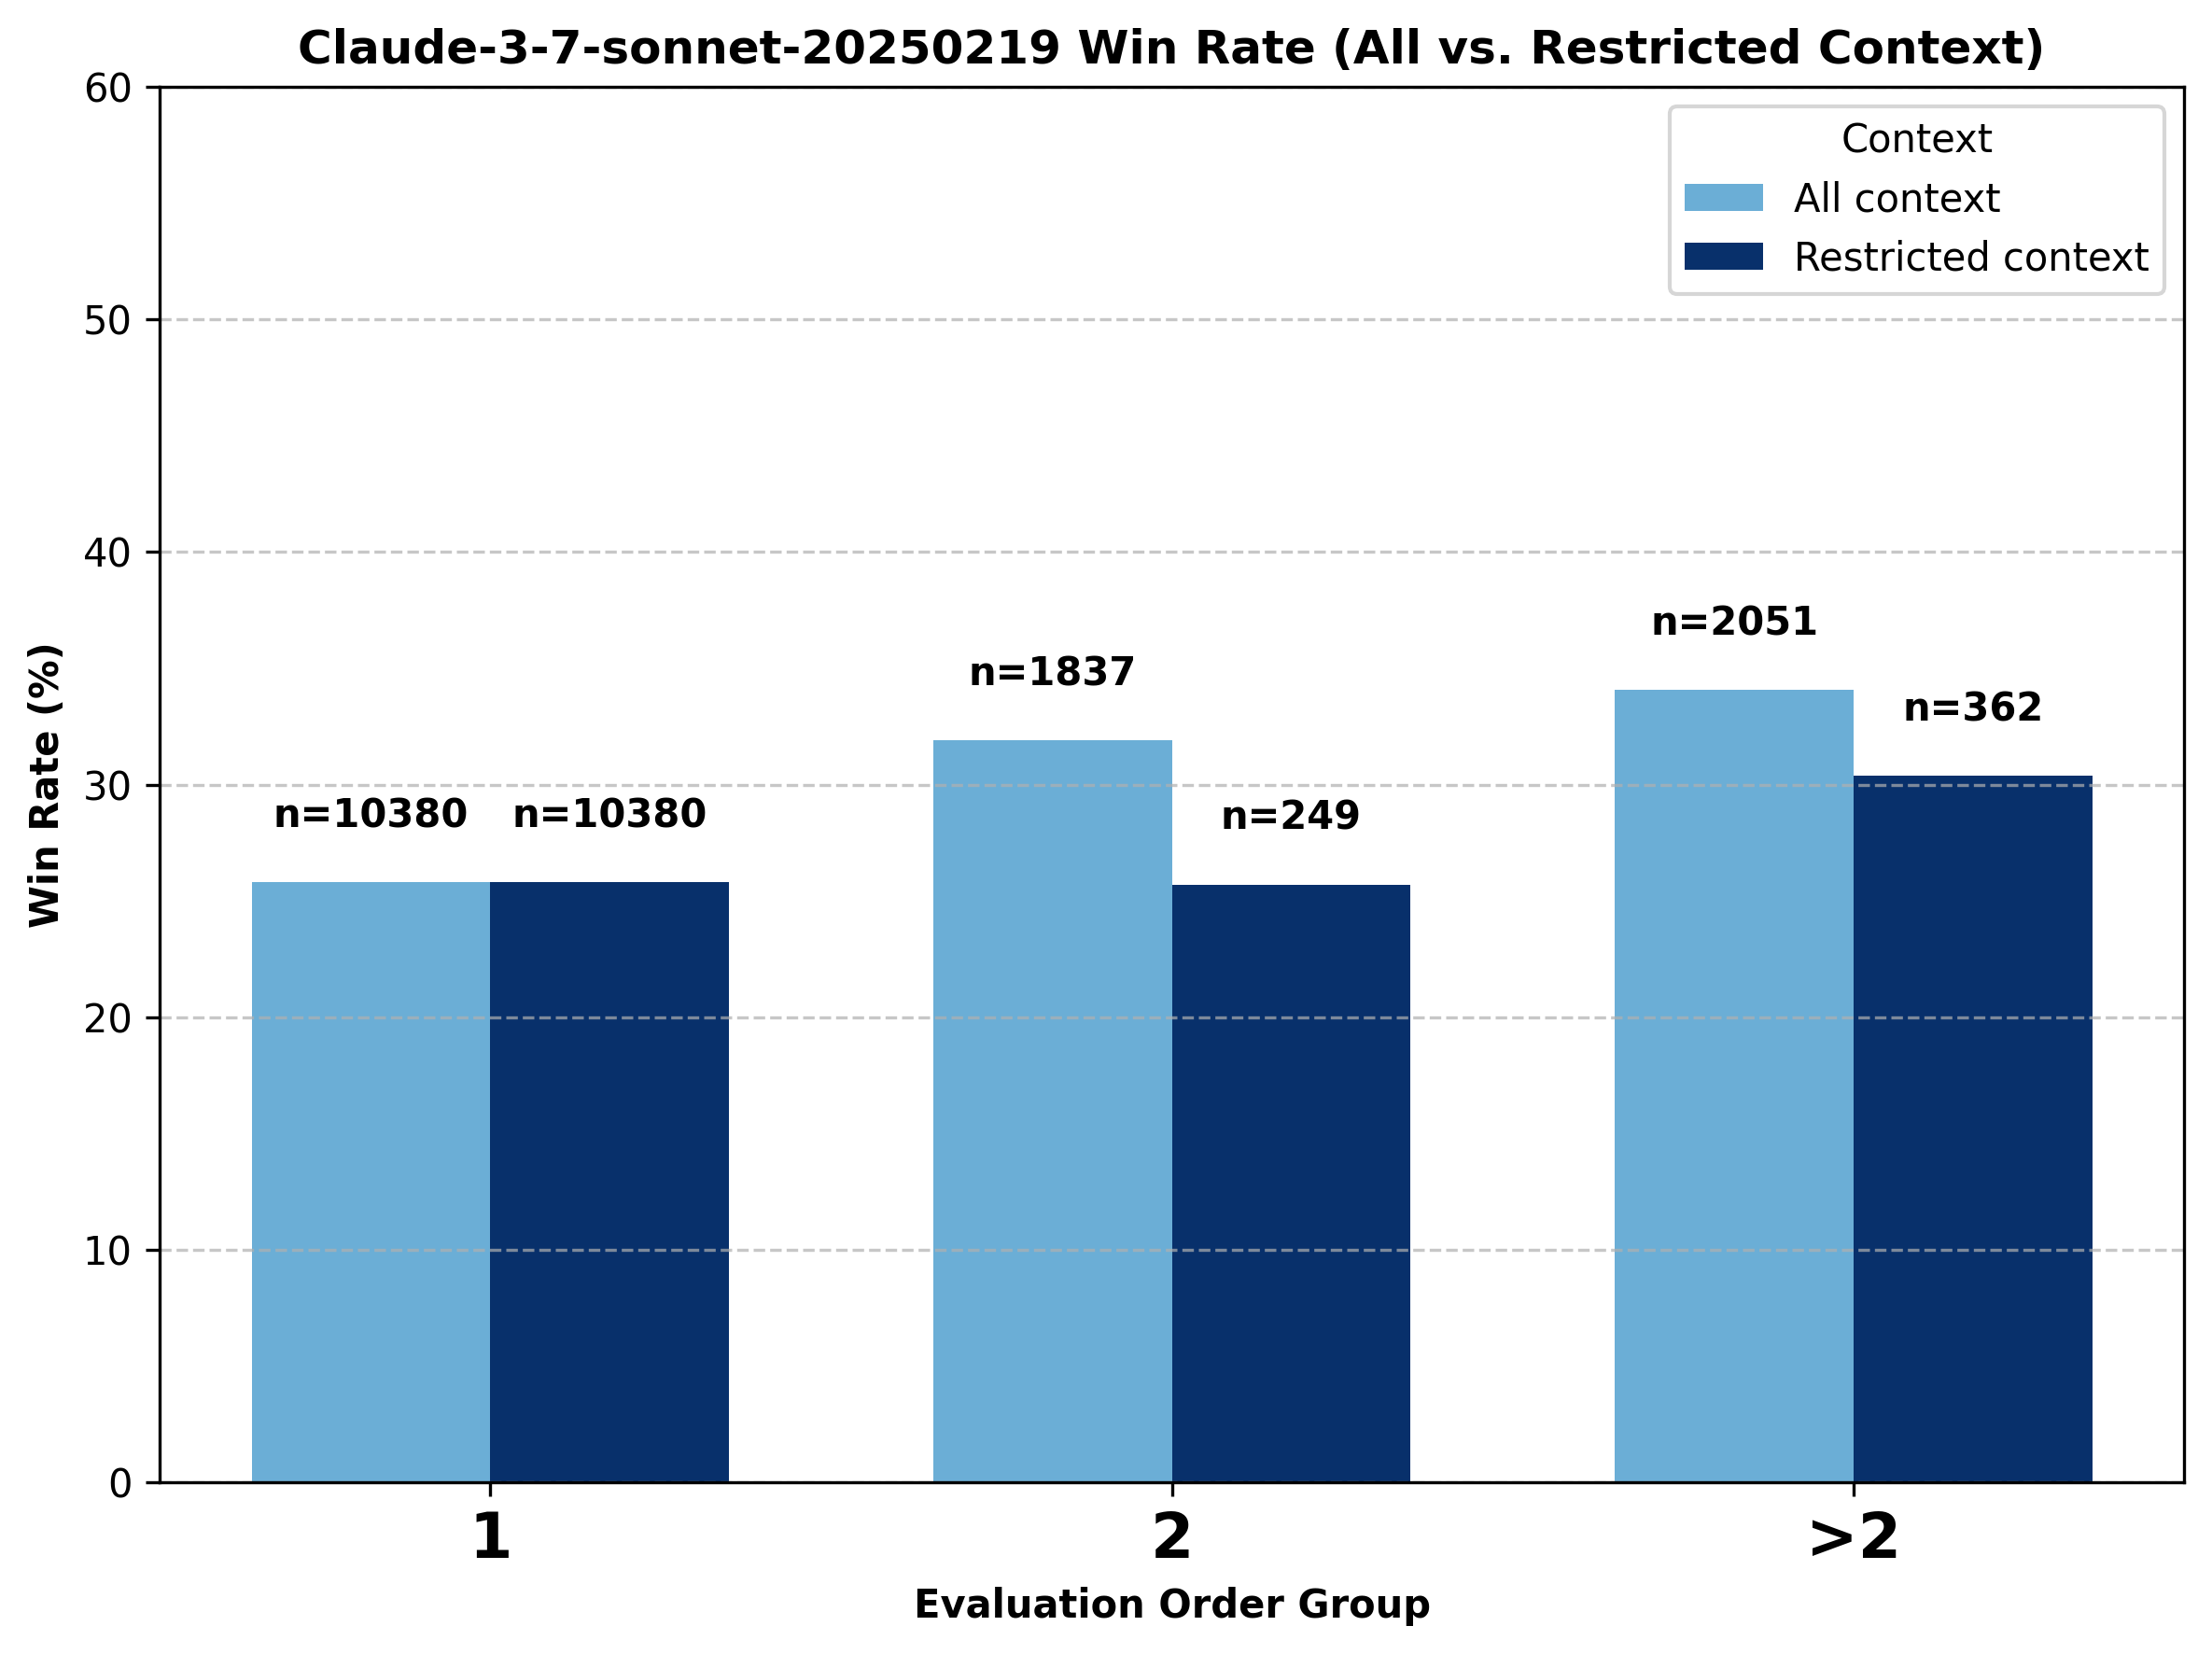
Figure 17. Comparison of change in battle outcome for claude-3-7-sonnet under all-context vs. restricted GPT-only context conditions.
We observe that the win rate of Claude-3-7-sonnet is higher for higher evaluation orders than for evaluation order equal to one, suggesting strong performance in longer conversations.
Style Coefficients
We take a look at coefficients quantifying the importance of style on recent data. We observe a fairly stable distribution over time; see Figure 18.
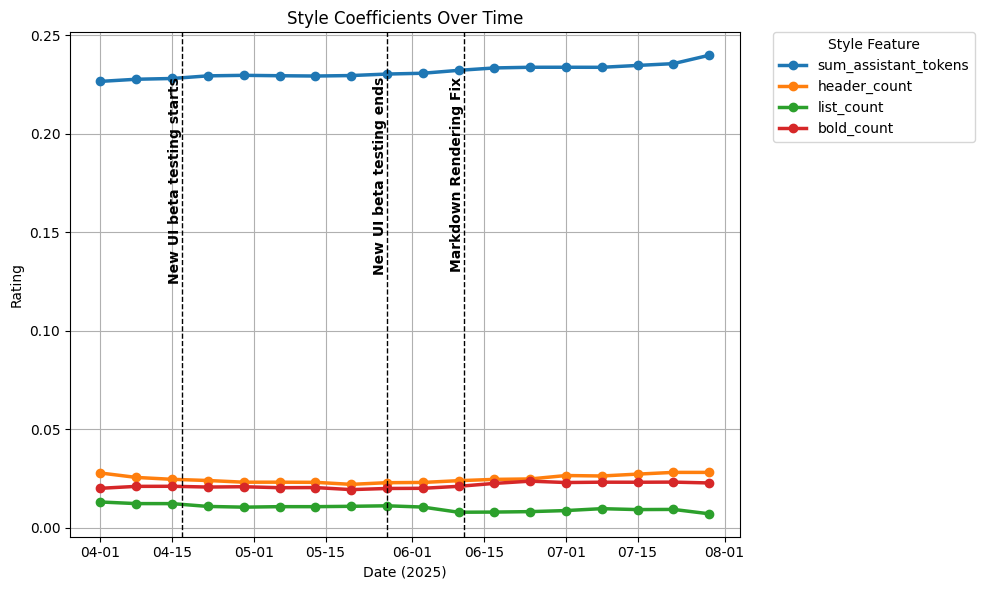
Figure 18. Style coefficients over time.
We also look at a categorical breakdown of style coefficients in Figure 19.
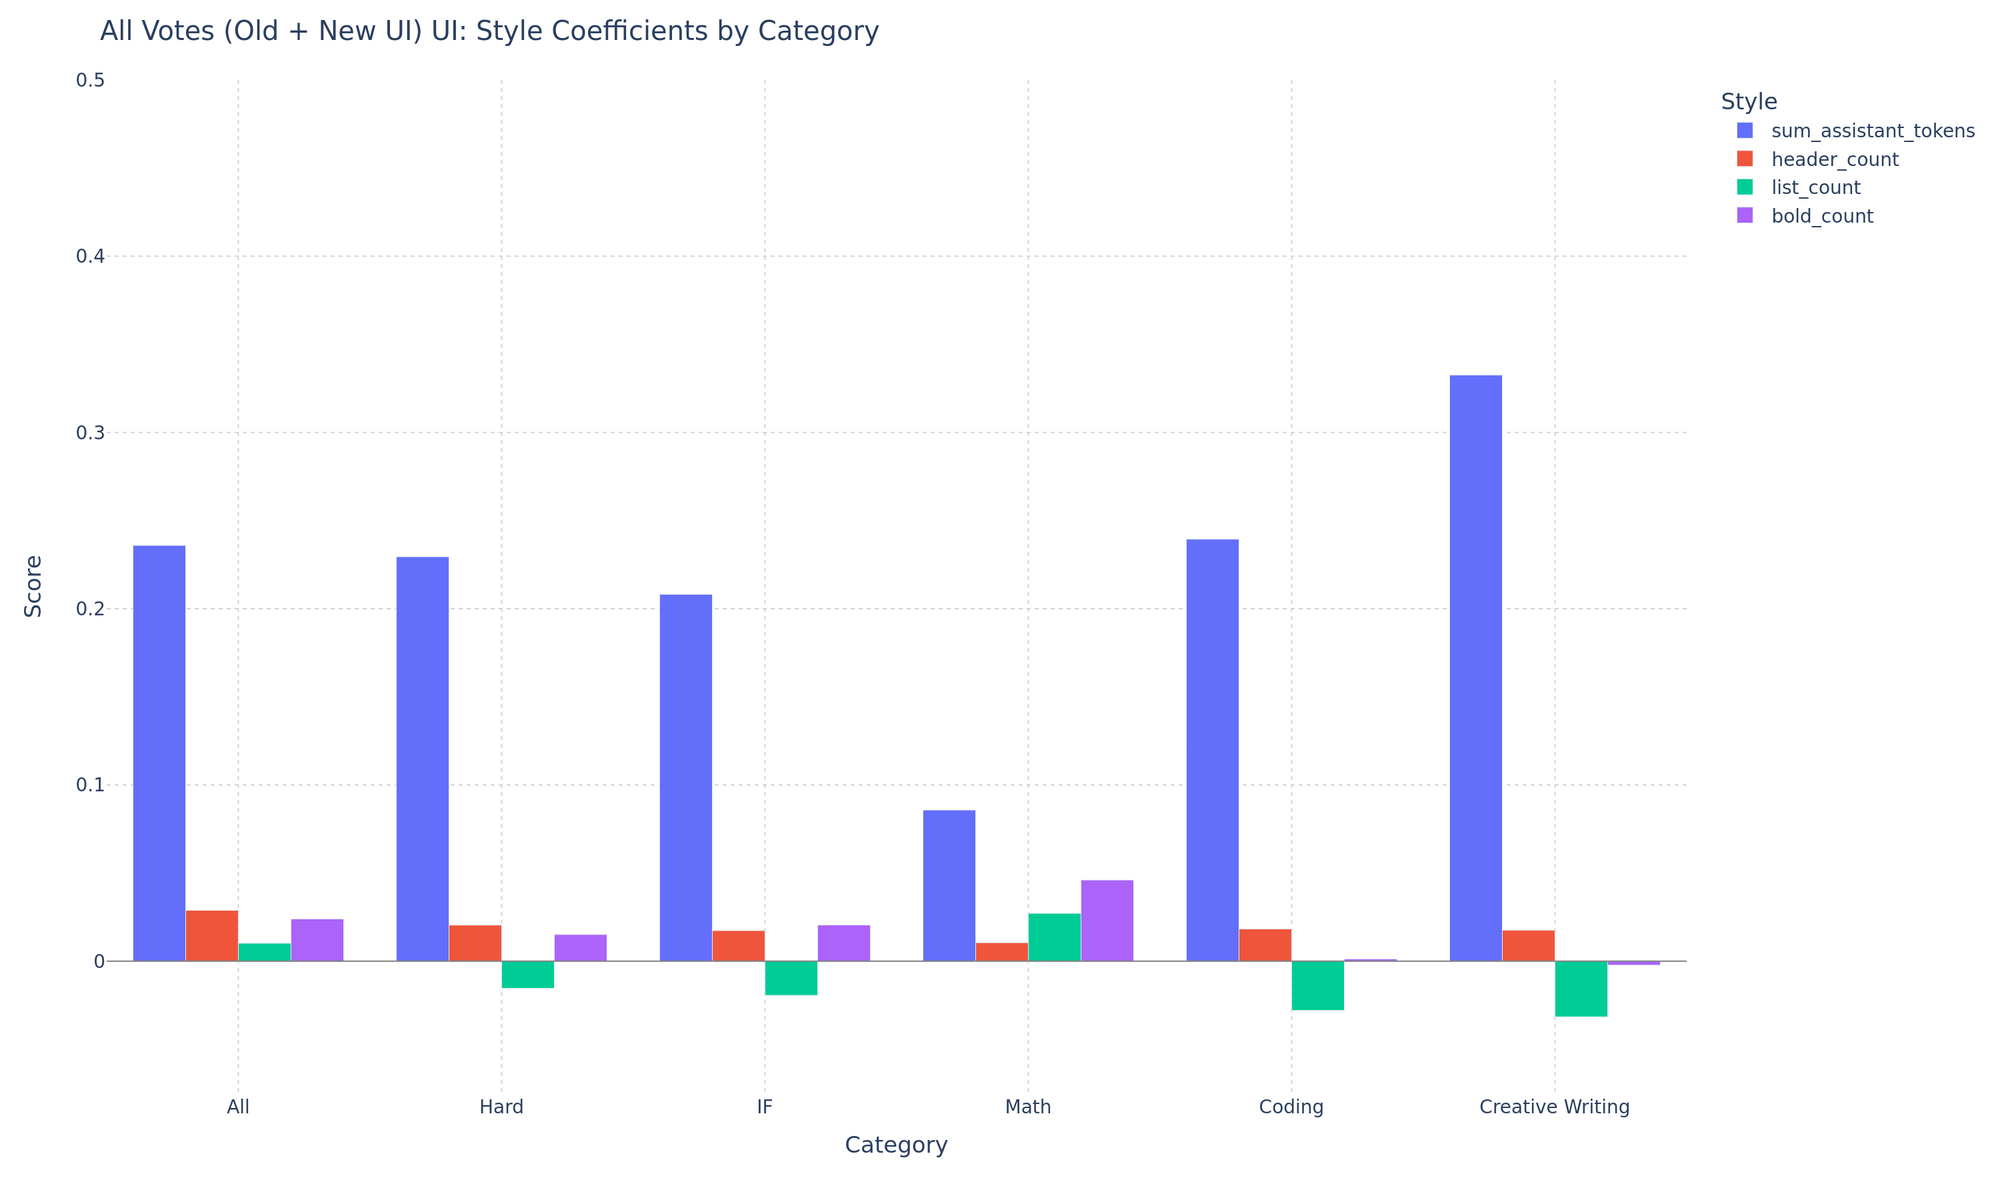
Figure 19. Categorical breakdown of style coefficients on the new UI
Further Analysis
Categorial Score Shifts
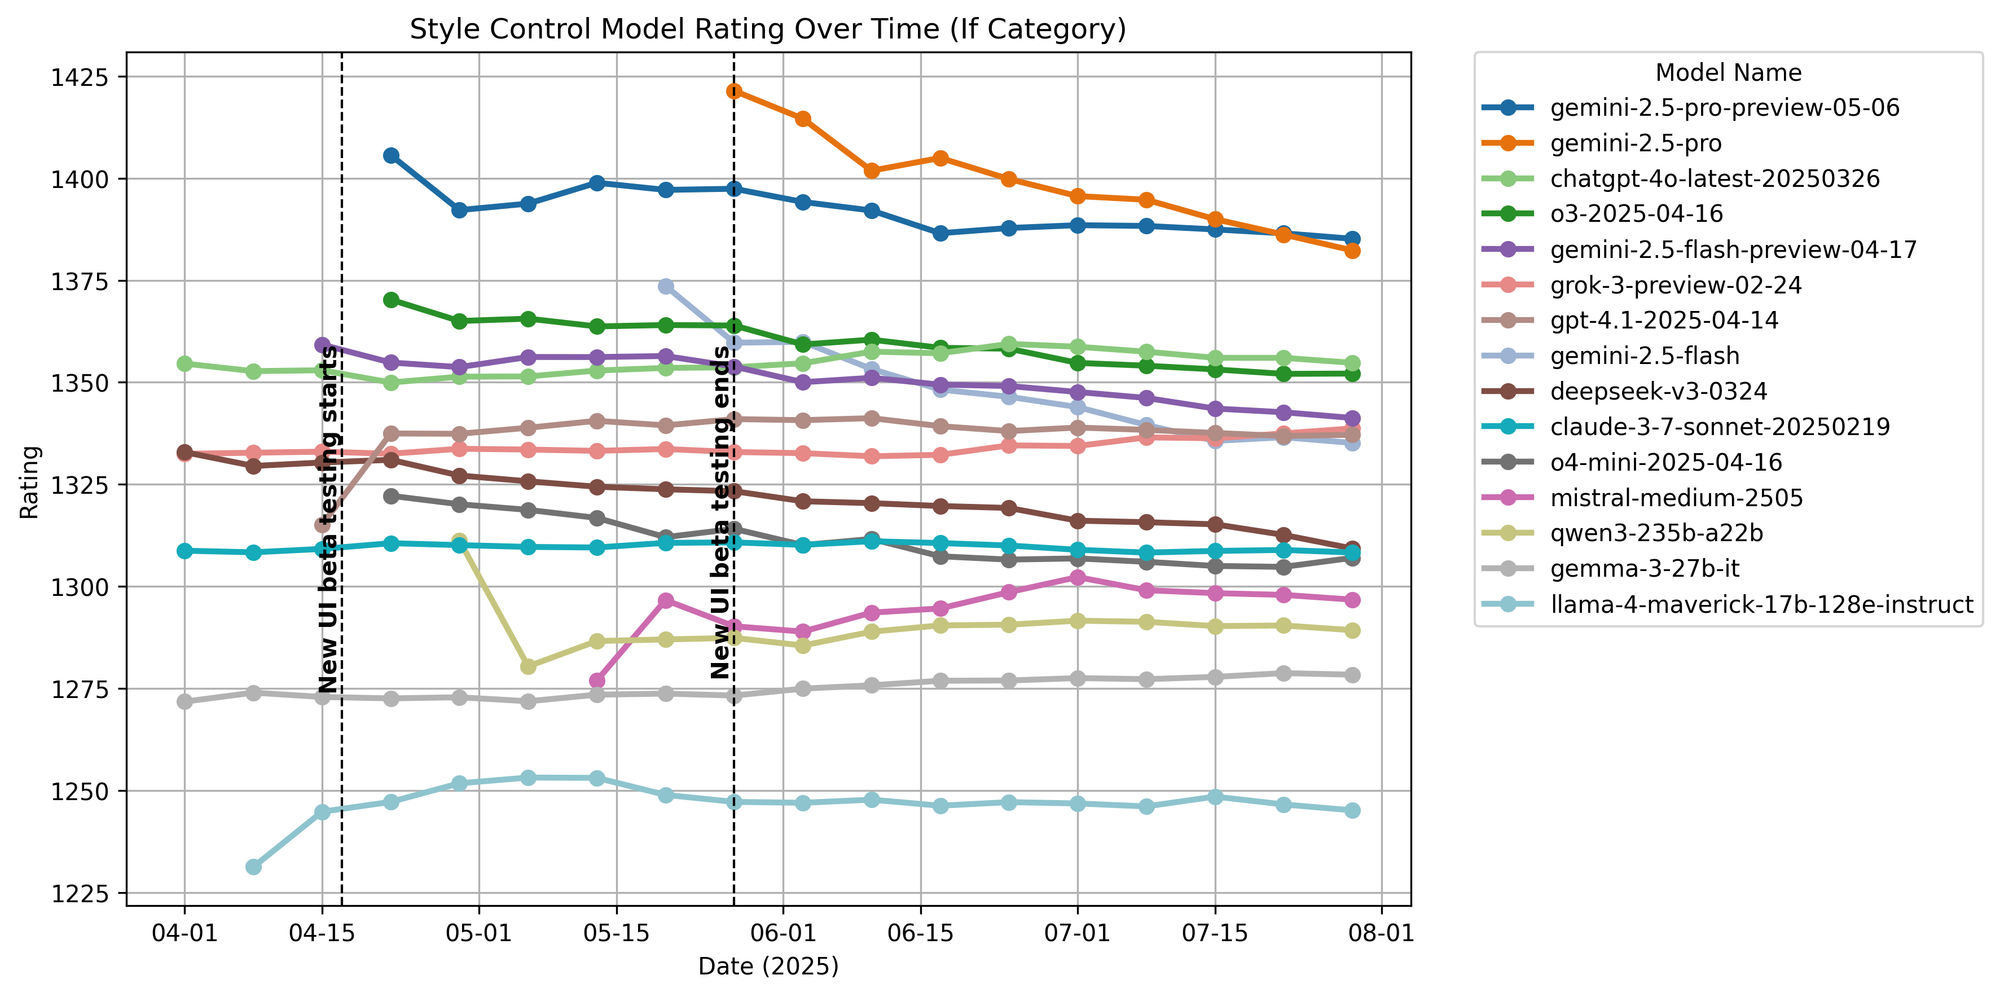
Figure 20. Instruction following ratings over time.
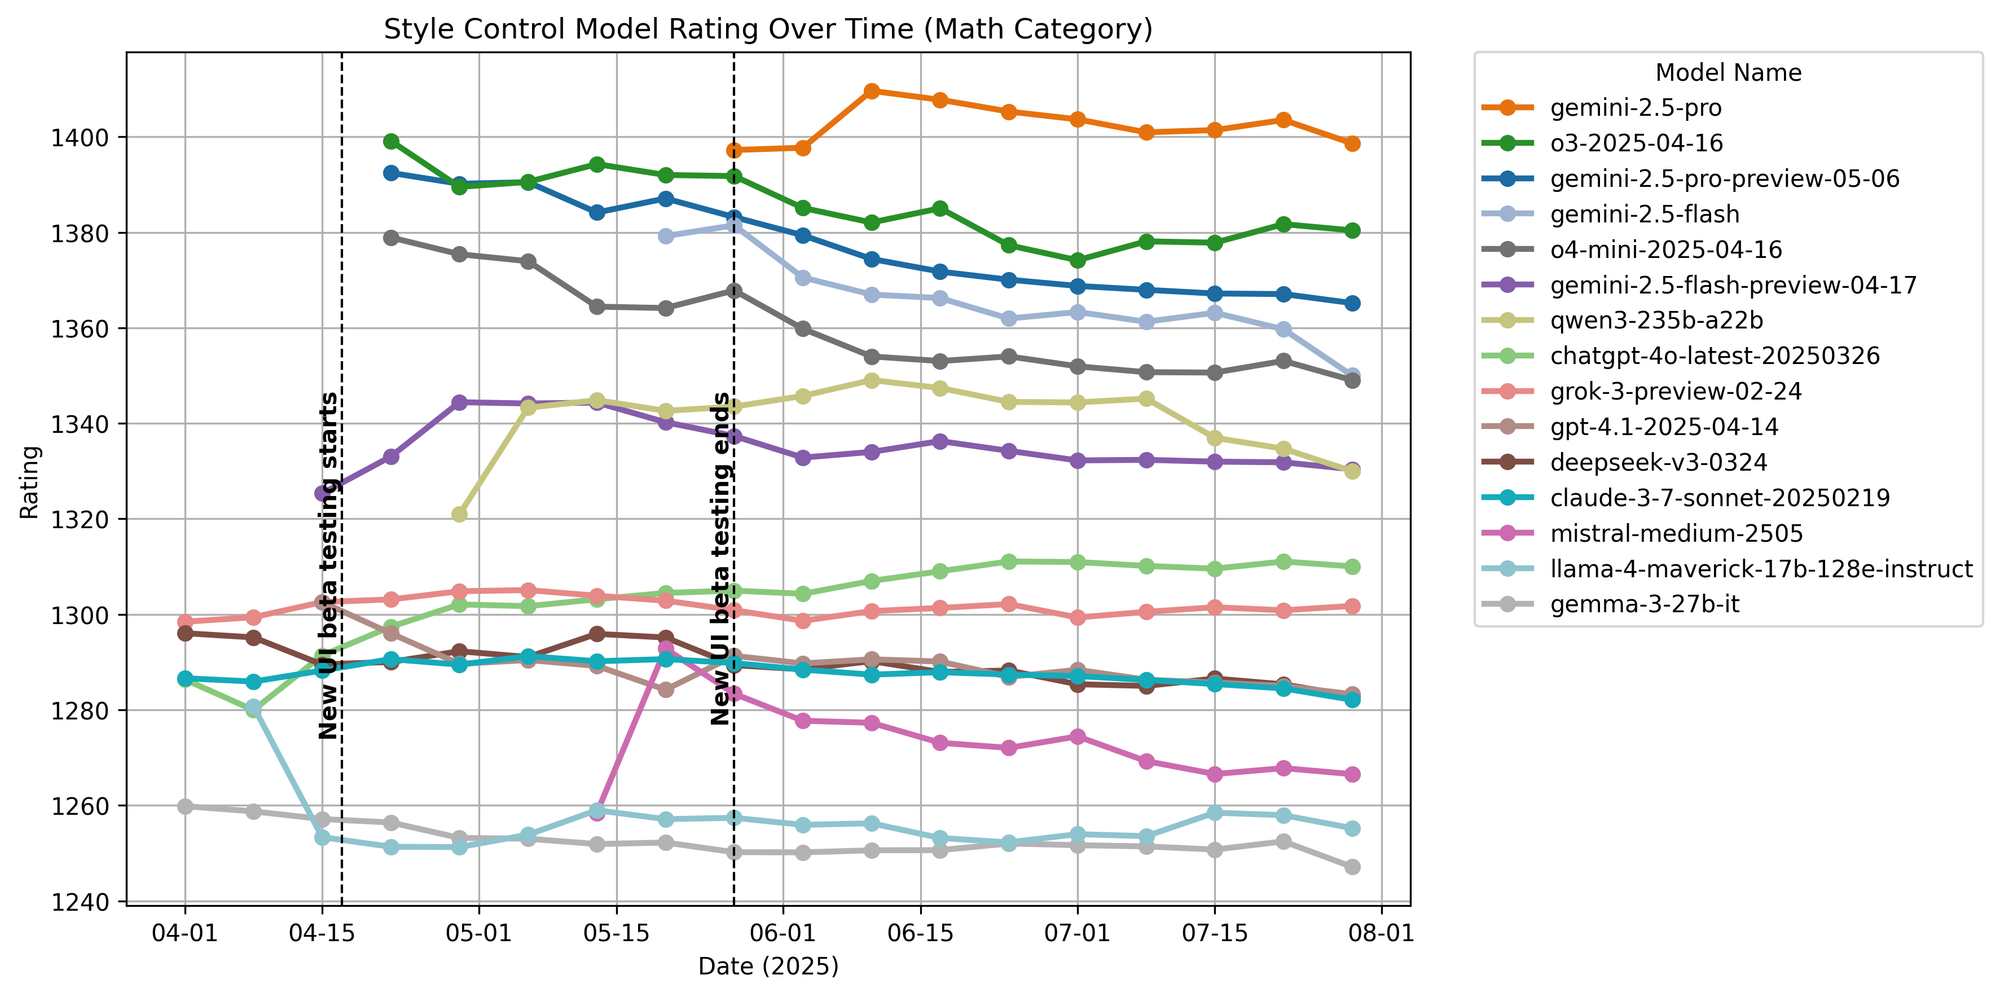
Figure 21. Math ratings over time.
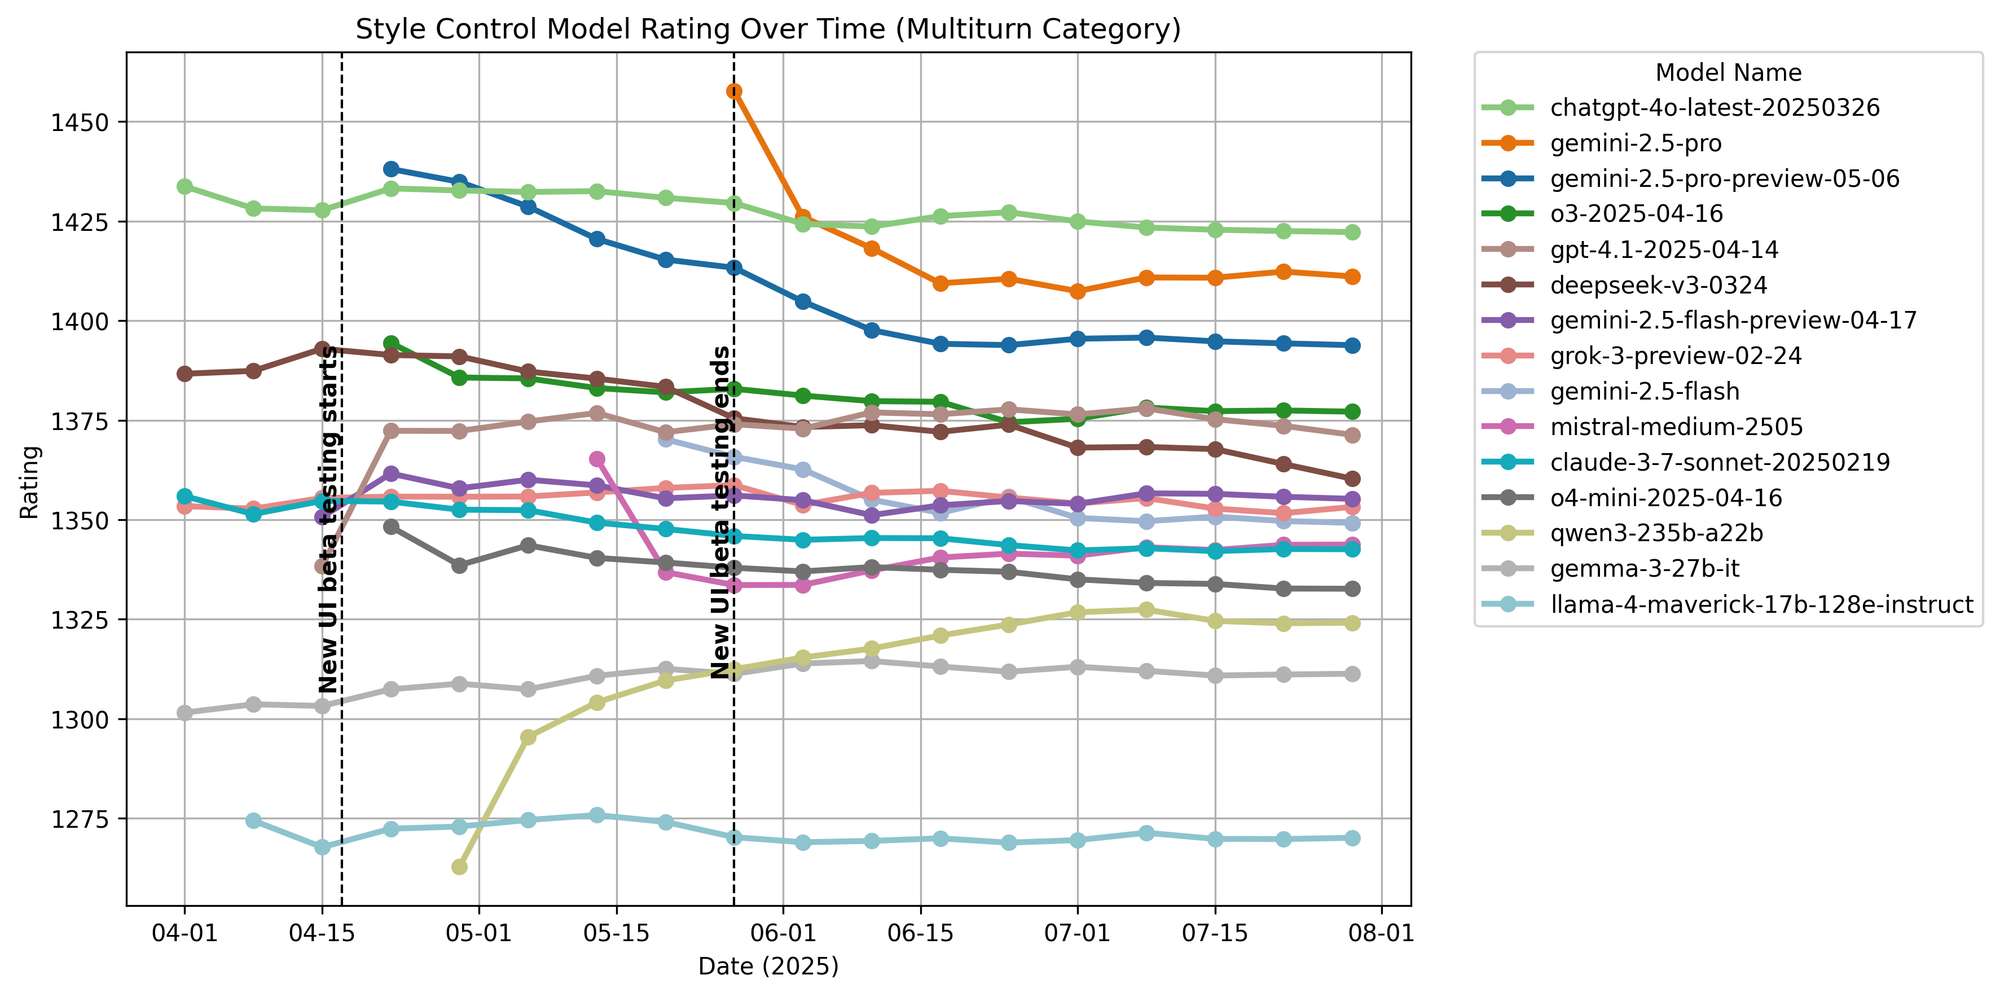
Figure 22. Multiturn ratings over time.
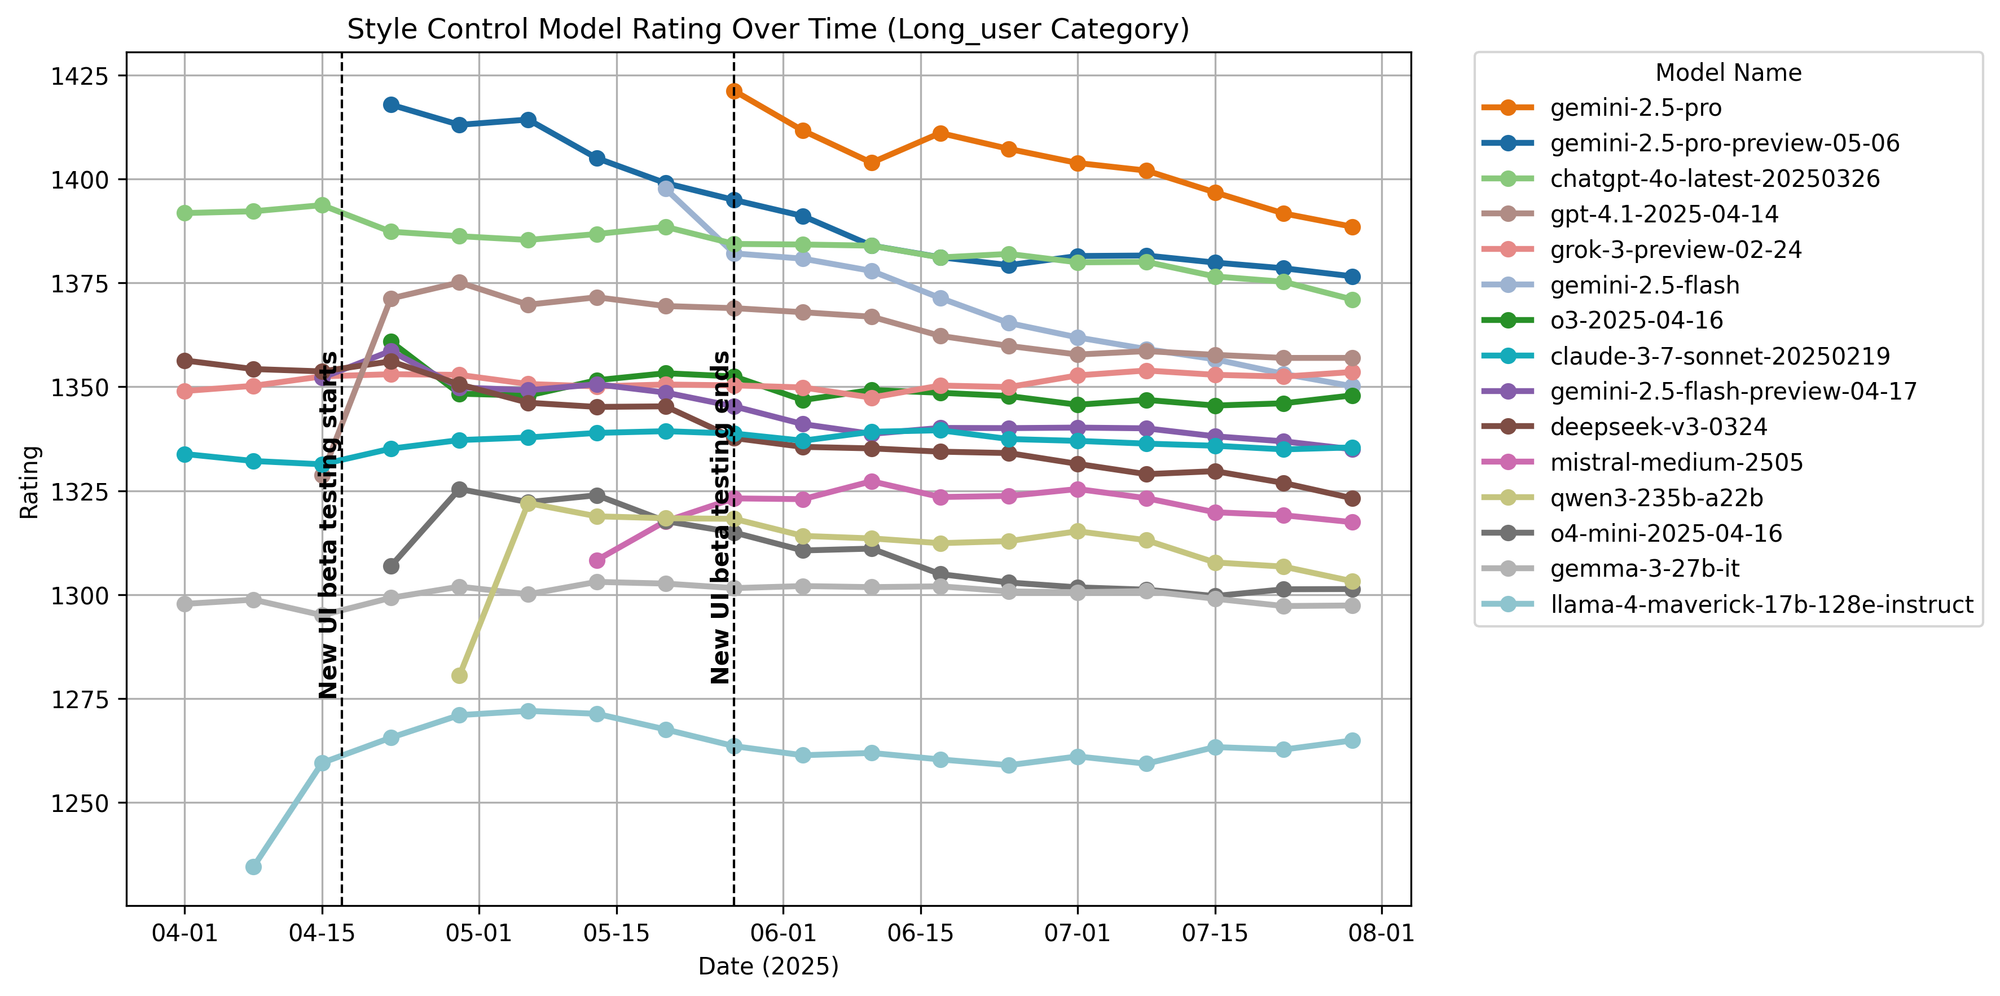
Figure 23. Long query ratings over time.
Released Dataset Overview
This dataset contains user votes collected in the text-only category. Each row represents a single vote judging two models (model_a and model_b) on a user conversation, along with the full conversation history and metadata. Key fields include:
id: Unique feedback ID of each vote/row.evaluation_session_id: Unique ID of each evaluation session, which can contain multiple separate votes/evaluations.evaluation_order: Evaluation order of the current vote.winner: Battle result containing eithermodel_a,model_b,tie, orboth_bad.conversation_a/conversation_b: Full conversation of the current evaluation order.full_conversation: The entire conversation, including context prompts and answers from all previous evaluation orders. Note that after each vote new models are sampled, thus the responding models vary across the full context.conv_metadata: Aggregated markdown and token counts for style control.category_tag: Annotation tags including the categories math, creative writing, hard prompts, and instruction following.is_code: Whether the conversation involves code.
To download the dataset, run
from datasets import load_dataset
data = load_dataset("lmarena-ai/arena-human-preference-140k")
We’re excited to share this dataset and hope it serves as a valuable resource for advancing research into real-world AI behavior and human preference.