
LMArena's Ranking Method
Since launching the platform, developing a rigorous and scientifically grounded evaluation methodology has been central to our mission. A key component of this effort is providing proper statistical uncertainty quantification for model scores and rankings. To that end, we have always reported confidence intervals alongside Arena scores and surfaced any ties in the rankings that those intervals imply.
Today, we are announcing an update to our ranking methodology that makes our rankings both more interpretable and more accurate in how they reflect statistical uncertainty. We are grateful to our community members for helpful suggestions that have led to this decision.
Alongside each model score, we are now reporting the raw rank and the rank spread for the respective model.
The raw rank is simply the rank of the model's Arena score. There are no ties in the rank column: each model is assigned a unique rank. Models in the leaderboard are sorted based on the raw rank.
Ties are reflected in the rank spread, which is an interval whose lower and upper endpoints correspond to the best and worst rank a model could have, based on all models' confidence intervals (CIs). The scores and confidence intervals remain unchanged. Formally, the best rank a model M can have is 1 + #{models whose lower CI endpoint is greater than model M's upper CI endpoint} . Analogously, the worst rank a model M can have is 1 + #{models whose upper CI endpoint is greater than model M's lower CI endpoint} . (The "1+" ensures that ranks cannot be zero; the best possible rank is one.)
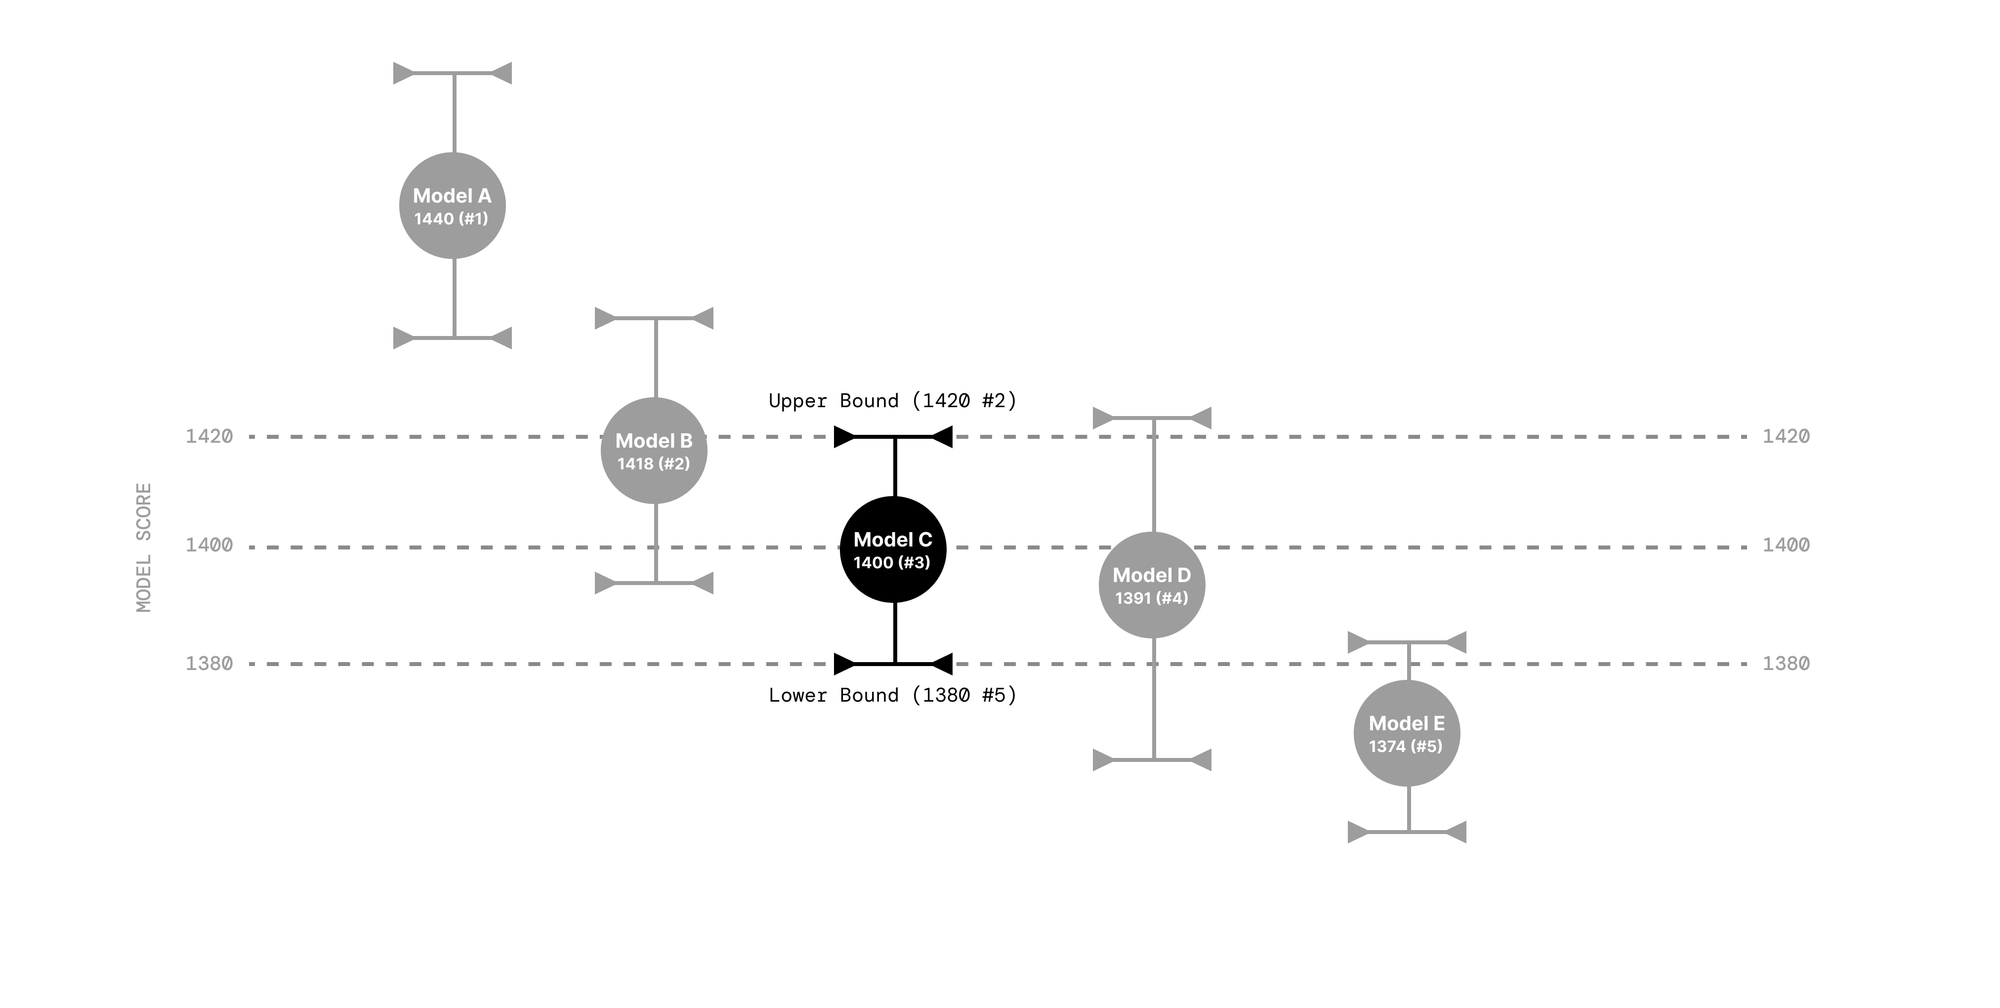
Intuitively, one can interpret the rank spread as follows. Suppose the true Arena score of model M is equal to the highest value included in its score's CI, and suppose that the true scores of all other models are the lowest values included in their respective CIs. This "optimistic" rank is the lower endpoint of model M's rank spread. The "pessimistic" rank is obtained analogously, by assuming model M's score is the lowest value included in its CI and all other models' scores are the highest values in their respective CIs. This is the upper endpoint of model M's rank spread.
Therefore, two models are tied if their rank spreads overlap. The raw ranking is the current best estimate of the true underlying ranking.
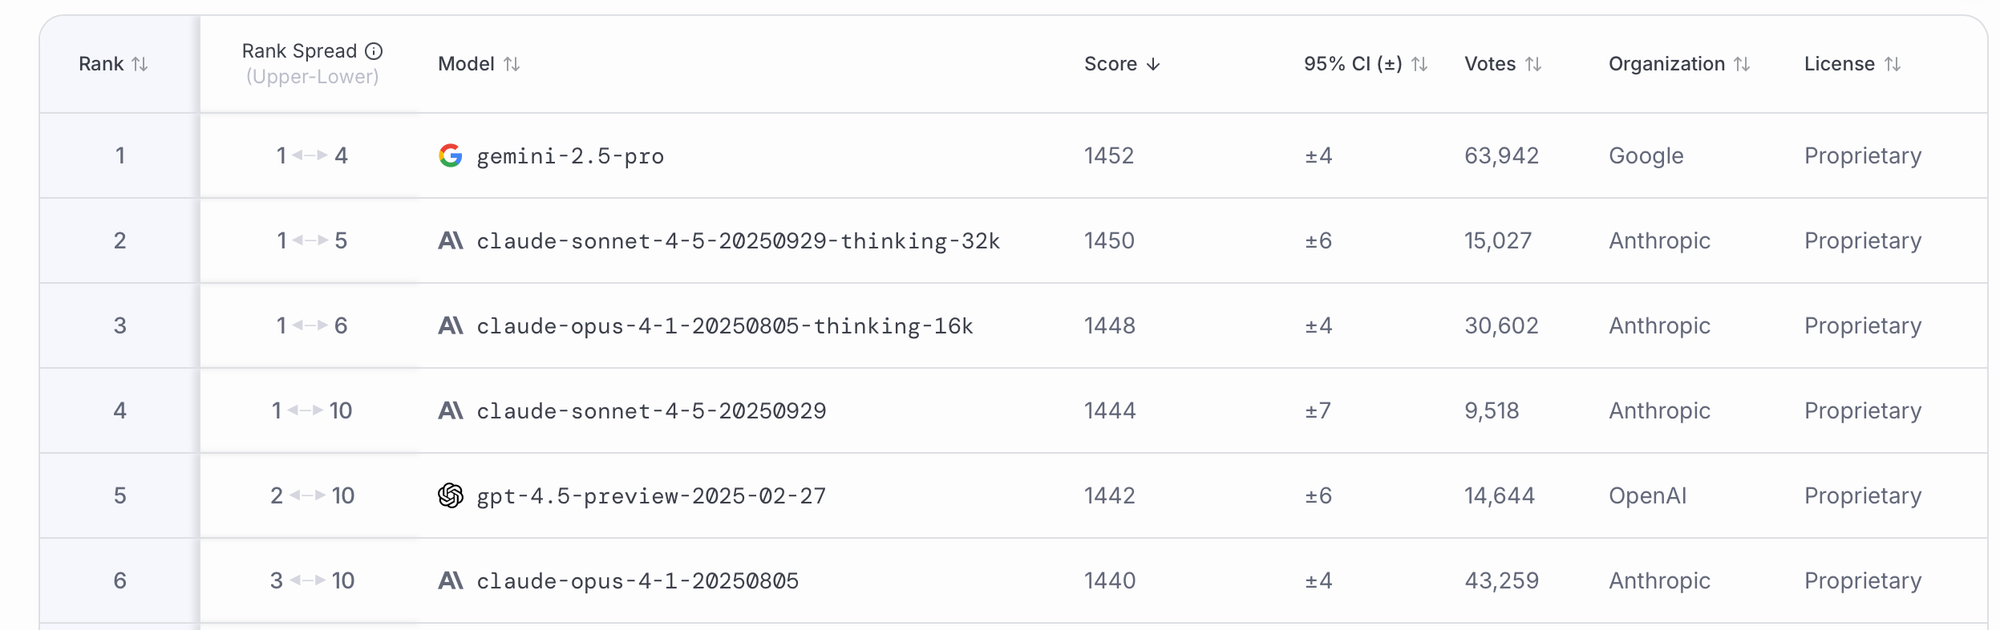
For example, in the screenshot above, gemini-2.5-pro , claude-sonnet-4-5-20250929-thinking-32k, claude-opus-4-1-20250805-thinking-16k , and claude-sonnet-4-5-20250929 are all contenders for the number one spot because their rank spread includes 1. However, based on current data our best estimate is that gemini-2.5-pro has the highest true underlying score.
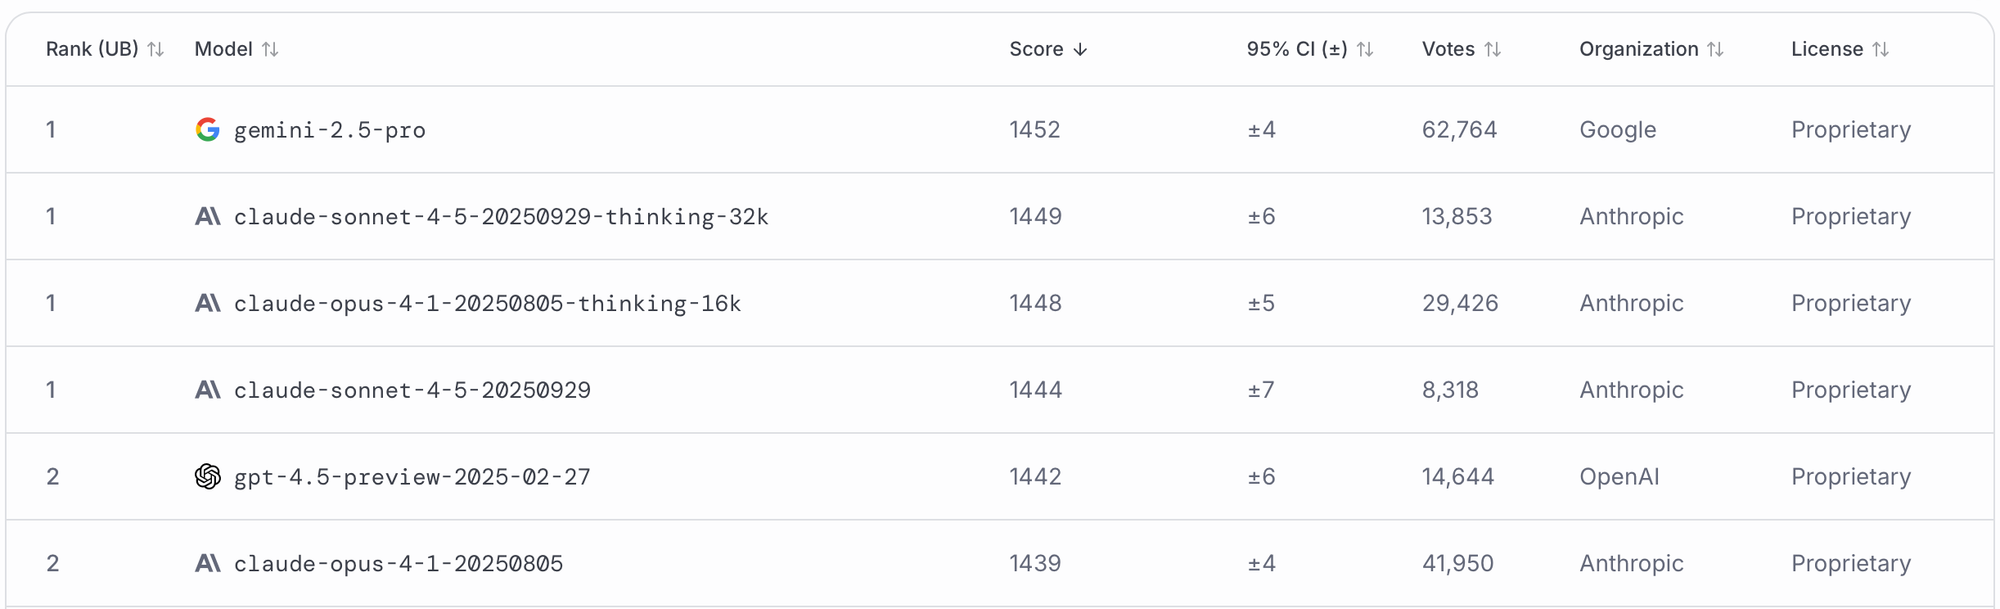
Previously, we only reported the "optimistic" rank, i.e. the lower endpoint of the rank spread, as described above. This methodology naturally assigned high ranks to models whose scores have high uncertainty, i.e. large CIs (for example, new models on the leaderboard). The new ranking method is more neutral, placing equal emphasis on the "optimistic" and the "pessimistic" ranking implied by the CIs.
Thank you again to our community members for their input and for helping us keep our evaluations rigorous, interpretable, and transparent. Follow and keep sharing feedback with us across: